Why Power BI Skills Matter for Modern Businesses in Oman
Power BI skills are becoming increasingly relevant for businesses in Oman as companies move toward digital reporting, automation and data-driven decision-making.
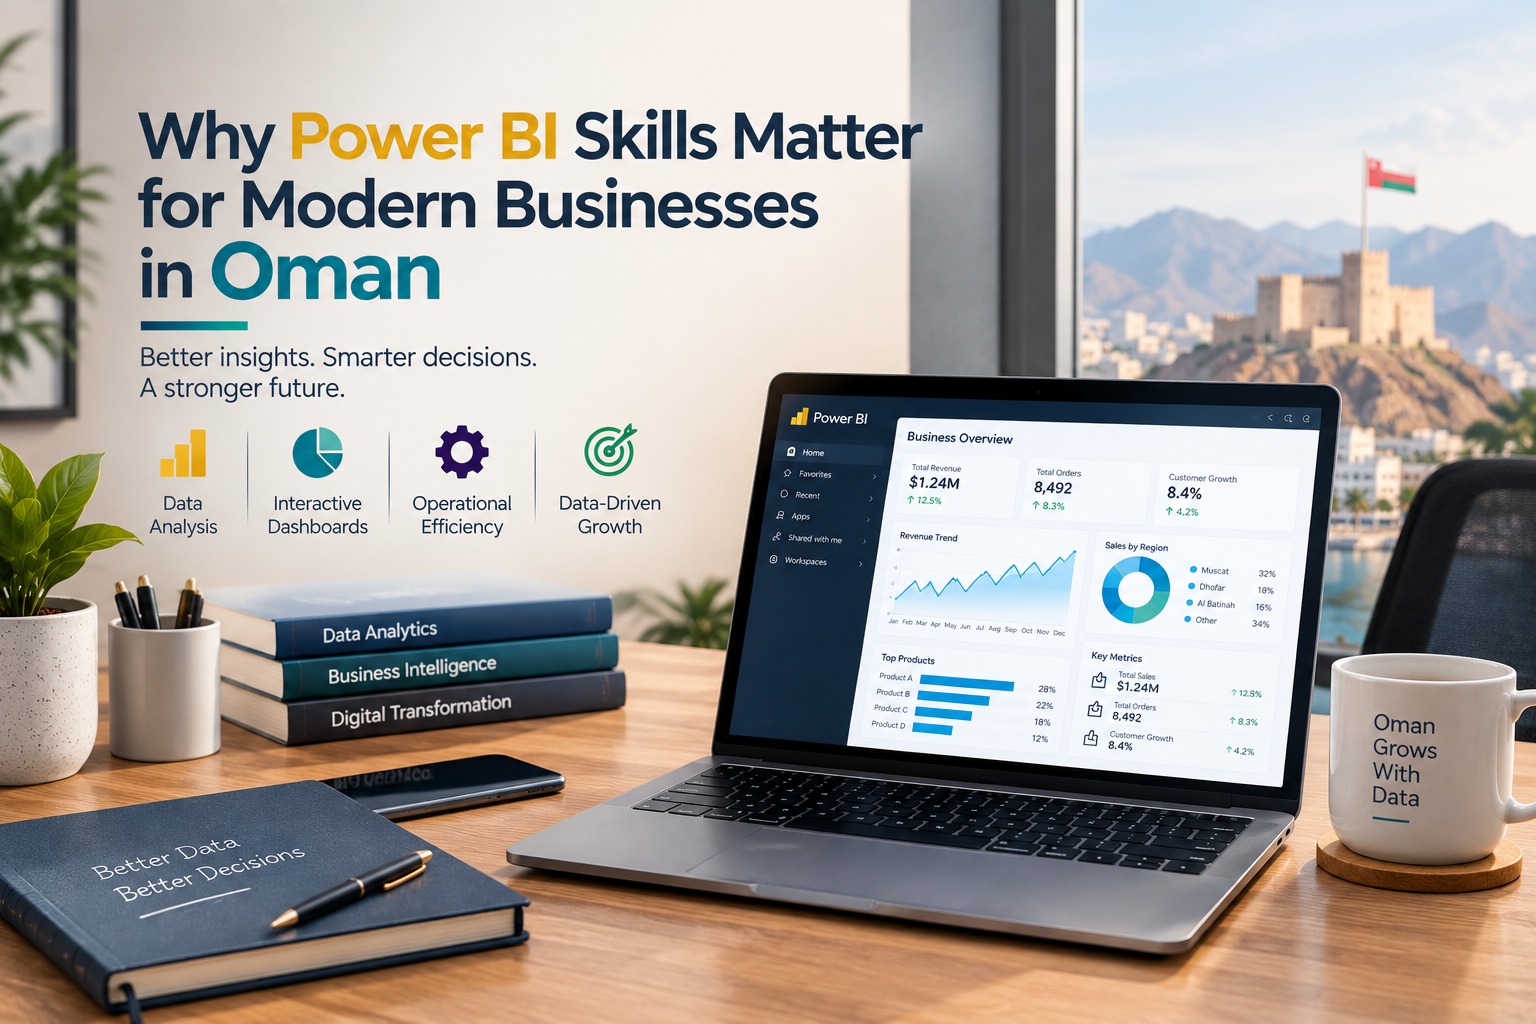
Power BI skills are becoming increasingly relevant for businesses in Oman as companies move toward digital reporting, automation and data-driven decision-making.
Oman’s National Program for Digital Economy aims for the digital economy to contribute 10% of GDP by 2040, while the country has also set a target of 80% digital transformation across five major economic sectors by 2030.
For businesses, this means professionals need more than basic spreadsheet skills. They increasingly need to work with Excel, Power BI, SQL, data modelling, dashboards and business analytics.
Why are Power BI skills important for businesses in Oman?
Power BI skills are important because businesses need more than raw data. They need a practical way to connect information, understand performance and act on what the numbers show.
Instead of sending static spreadsheets between departments, teams can use Power BI to build interactive reports that bring important metrics into one place.
For example, a sales manager can monitor revenue and targets, an operations team can track productivity, and a finance team can analyse costs and margins through dashboards.
This makes Power BI more than a reporting tool. It becomes part of a broader business intelligence and data-driven decision-making workflow.
Oman's digital transformation agenda also places importance on advanced technologies, workforce skills and data-supported decision-making. The National Digital Economy Program aims to develop skills that match labour-market requirements and future digital demands.
What is Power BI and how does it help businesses?
Microsoft Power BI is a business intelligence platform that helps users connect to data, transform it, model it and create interactive reports and dashboards.
Power BI can connect with sources such as:
- Excel
- SQL Server
- SharePoint
- CSV files
- Cloud databases
- Microsoft services
- CRM and business applications
- Other supported data sources
The basic business workflow is:
Connect → Clean → Model → Analyse → Visualise → Share → Decide
Power BI supports a wide range of data sources through Power Query, while dashboards can bring important metrics together for monitoring.
This means a company does not necessarily need to abandon Excel. Instead, Excel can remain part of the workflow while Power BI handles larger reporting and dashboard requirements.
How can Power BI improve business reporting in Oman?
Power BI can improve reporting by reducing repetitive manual work and giving teams a more consistent view of business performance.
Consider a company that prepares a monthly management report.
A traditional process may look like:
Collect files → Copy data → Clean spreadsheets → Create formulas → Build charts → Prepare presentation → Email report
With a structured Power BI workflow, it can become:
Connect data → Transform → Refresh → Analyse → Share dashboard
The exact amount of automation depends on the company's data sources, architecture and Power BI setup, but the basic advantage is clear: teams can spend less time rebuilding the same report and more time understanding the results.
7 business benefits of Power BI skills
1. Faster management reporting
Power BI can bring multiple datasets into a single reporting environment.
Instead of preparing separate reports for sales, finance and operations, businesses can build dashboards around common KPIs.
This can help managers see important changes without waiting for a manually prepared report.
2. Better KPI visibility
A business dashboard can track metrics such as:
| Business area | Example KPIs |
|---|---|
| Sales | Revenue, conversion, target achievement |
| Finance | Revenue, cost, margin, cash flow |
| Operations | Productivity, downtime, output |
| HR | Headcount, attendance, attrition |
| Supply Chain | Inventory, delivery, fulfilment |
| Marketing | Leads, conversions, campaign performance |
| Customer Service | Tickets, response time, satisfaction |
The value comes from connecting KPIs to actual business questions.
A dashboard should not simply display numbers. It should help a manager understand what requires attention.
3. Less dependence on manual spreadsheets
Excel remains extremely useful, but manually combining multiple files every week can create errors and consume time.
Power BI can use Power Query to transform and prepare data before it reaches the report.
For businesses with recurring reporting requirements, this can create a more repeatable process.
4. One view of multiple data sources
Modern businesses rarely keep every piece of information in one file.
Sales may be in one system, finance in another, operations in Excel and customer information in a CRM.
Power BI supports many different data connectors, allowing organisations to bring information from different sources into analytics workflows.
This is particularly useful when management needs a combined view instead of separate departmental reports.
5. More data-driven decisions
The purpose of business intelligence is not to create more charts.
The purpose is to help people make better-informed decisions.
For example:
Sales are falling → identify the affected region → analyse products → compare customer segments → investigate the cause → decide what action to take.
Power BI can make this type of analysis easier through filtering, drill-downs, comparisons and interactive visualisation.
6. Better collaboration between teams
When departments use different spreadsheets and definitions for the same KPI, management can receive conflicting numbers.
A properly designed Power BI semantic model can create a more consistent analytical foundation.
Teams can then work from shared definitions of metrics such as revenue, sales growth, target achievement and customer retention.
7. Scalable business intelligence
A small reporting workflow may begin with Excel.
As the organisation grows, it may need:
- More data
- More users
- More dashboards
- More frequent refreshes
- More data sources
- Better security
- Centralised reporting
Power BI can support this progression when the underlying data model, governance and architecture are designed properly.
Which industries in Oman can benefit from Power BI?
Power BI can support almost any industry that depends on operational, financial or customer data.
Oman's economy includes sectors where data analytics can have practical applications, including energy, manufacturing, logistics, tourism, finance, retail and government.
Power BI skills can be relevant across several sectors, including:
| Sector | Example Power BI Use |
|---|---|
| Manufacturing | Production, quality and inventory dashboards |
| Oil & Gas | Operations, costs and performance reporting |
| Logistics | Delivery, fleet and supply-chain analysis |
| Banking & Finance | Revenue, risk and financial KPIs |
| Retail | Sales, customers and inventory |
| Government | Service performance and operational reporting |
Oman’s Vision 2040 programs specifically emphasize digital transformation, economic diversification and developing skills needed for the future labour market.
What Power BI skills do professionals in Oman need?
Knowing how to create a chart is only the beginning.
Professionals who want to use Power BI effectively should build skills across the complete analytics workflow.
| Skill | Why it matters |
|---|---|
| Power Query | Clean and transform data |
| Data modelling | Structure data correctly |
| DAX | Create business calculations |
| Data visualisation | Communicate insights |
| KPI design | Focus reports on business goals |
| Power BI Service | Publish and share reports |
| Security | Control access to information |
| Dashboard design | Make reports easier to use |
| Excel | Work with common business data |
| SQL | Retrieve data from databases |
| Business thinking | Connect analysis to decisions |
This is also why Power BI should not be learned in isolation.
For many professionals, a combination of Excel + Power BI + SQL + business analytics provides a stronger foundation.
Power BI vs Excel: Do businesses in Oman need both?
Businesses usually do not need to choose between Excel and Power BI. The two tools can serve different purposes.
| Excel | Power BI |
|---|---|
| Detailed spreadsheet work | Interactive business dashboards |
| Ad hoc analysis | Recurring management reporting |
| Manual data entry | Connected data sources |
| Small-team analysis | Wider information sharing |
| Flexible calculations | Data models and DAX |
| Working documents | Decision-support dashboards |
Excel is often better when someone needs to manipulate individual values or perform quick analysis.
Power BI becomes more useful when reporting involves multiple users, repeated refreshes, multiple data sources or interactive dashboards.
The practical question is not “Excel or Power BI?”
It is:
“Which part of the workflow should Excel handle, and which part should Power BI handle?”
How can companies build Power BI capability?
Companies should start with business requirements rather than software features.
A practical process is:
Step 1: Identify reporting problems
Find reports that take too much time, depend on manual spreadsheets or contain inconsistent numbers.
Step 2: Identify important KPIs
Decide which metrics managers actually need.
Step 3: Map the data sources
Identify where the information currently lives.
Step 4: Build a clean data model
Do not start with visual design. Start with reliable data and logical relationships.
Step 5: Train employees using real business data
Generic examples can teach features, but real company data helps employees understand how Power BI fits their daily work.
Step 6: Create a pilot dashboard
Start with one important business problem rather than trying to transform every report at once.
Step 7: Establish governance
Define permissions, ownership, refresh schedules, data quality checks and reporting standards.
Common Power BI mistakes businesses should avoid
Building dashboards without a business question
A dashboard can look impressive and still provide little value.
Start with:
What decision should this dashboard help someone make?
Using too many visuals
More charts do not automatically mean better analysis.
A good dashboard should highlight the most important information first.
Ignoring data modelling
Poor relationships can create incorrect results, slow reports and confusing calculations.
Data modelling should come before dashboard decoration.
Treating Power BI as an Excel replacement
Power BI and Excel have different strengths.
The strongest workflows often use both.
Training without practical application
Employees may remember Power BI features during a course and then struggle to use them at work.
Training should include realistic datasets, business scenarios and actual reporting problems.
What does Power BI mean for Oman's future workforce?
Power BI is part of a wider shift toward data literacy and digital business skills.
Oman is investing in digital transformation, developing digital capabilities and encouraging organisations to adopt modern technologies.
For professionals, this means understanding how to work with data can complement existing expertise in finance, operations, HR, sales, supply chain, engineering or management.
For employers, the goal should not simply be to have employees who know Power BI.
The goal should be to have teams that can:
Understand data → analyse performance → communicate insights → make better decisions.
How should professionals start learning Power BI?
A practical learning path is:
- Strengthen Excel and data fundamentals.
- Learn Power Query for data preparation.
- Understand Power BI data modelling.
- Learn DAX for business calculations.
- Build interactive dashboards.
- Learn Power BI Service and sharing.
- Understand security and governance.
- Connect Power BI with SQL and other business data sources.
- Build projects using realistic business scenarios.
- Learn how to explain insights to non-technical stakeholders.
Professionals who already work with Excel may find Power BI a natural next step into business intelligence and analytics.
FAQs
Is Power BI useful for businesses in Oman?
Yes. Power BI can help businesses analyse data, monitor KPIs, automate recurring reporting and create interactive dashboards. Its value depends on the quality of the data, reporting process and business questions being addressed.
Why should companies in Oman learn Power BI?
Companies can use Power BI to improve reporting, connect data sources, monitor performance and support data-driven decision-making. It can be especially useful for teams that depend heavily on recurring Excel-based reports.
Is Power BI in demand in Oman?
Power BI appears in Oman job and professional-training contexts alongside skills such as Excel, SQL, Python, Power Query and DAX. Demand varies by industry, role and employer, so Power BI should be viewed as part of a broader analytics skill set.
Is Power BI better than Excel?
Neither tool is universally better. Excel works well for spreadsheet-based analysis and flexible calculations, while Power BI is designed for interactive reporting, dashboards, data models and broader business intelligence workflows.
What Power BI skills should professionals learn?
Professionals should learn Power Query, data modelling, DAX, visualisation, dashboard design, Power BI Service and basic governance. Excel and SQL are also useful supporting skills.
Can Power BI help automate business reporting?
Yes. Power BI can support repeatable reporting workflows by connecting to data sources, transforming data and refreshing reports. The level of automation depends on the organisation's data architecture and configuration.
Which industries can use Power BI in Oman?
Power BI can support manufacturing, energy, oil and gas, logistics, finance, retail, tourism, healthcare, education and government. Any organisation that uses operational or financial data can potentially benefit from business intelligence.
Do employees need SQL to learn Power BI?
No. SQL is not mandatory for starting Power BI. However, SQL becomes valuable when professionals need to work with relational databases or larger business datasets.
Is Power BI useful for management teams?
Yes. Management teams can use dashboards to monitor KPIs, compare performance, identify trends and review business information without relying entirely on manually prepared reports.
How can companies train employees in Power BI?
Companies can use instructor-led corporate training, internal learning programmes or customised workshops. The most useful approach is to combine Power BI concepts with the organisation's actual reporting workflows and business requirements.
The future of business reporting in Oman
Power BI is not valuable simply because it creates attractive dashboards. Its real value comes from helping organisations connect data with decisions.
Final Takeaway
Power BI is becoming part of the broader data and digital transformation skill set needed by modern businesses.
For professionals in Oman, learning Excel + Power BI + SQL + business analytics can provide a practical foundation for working with business data.
The key is to go beyond learning how to create charts. Professionals should learn how to clean data, build meaningful KPIs, analyse trends and turn data into business decisions.
TechnoExcel provides practical Power BI, Excel and Data Analytics training using real business scenarios, along with customised corporate programmes designed around an organisation's data, KPIs and reporting needs.
This topic is covered in the Power BI Mastery course. Sessions are live, practical and taught with real business data — a natural next step if this article matches what you are working on.