How to Create a Manufacturing Dashboard in Power BI
A manufacturing dashboard in Power BI helps manufacturers monitor production output, machine performance, downtime, quality, inventory, and operational costs in one place. You can build one by connecting factory data, cleaning it with Power Query, creating DAX measures, and designing interactive reports around the KPIs that matter to your plant.
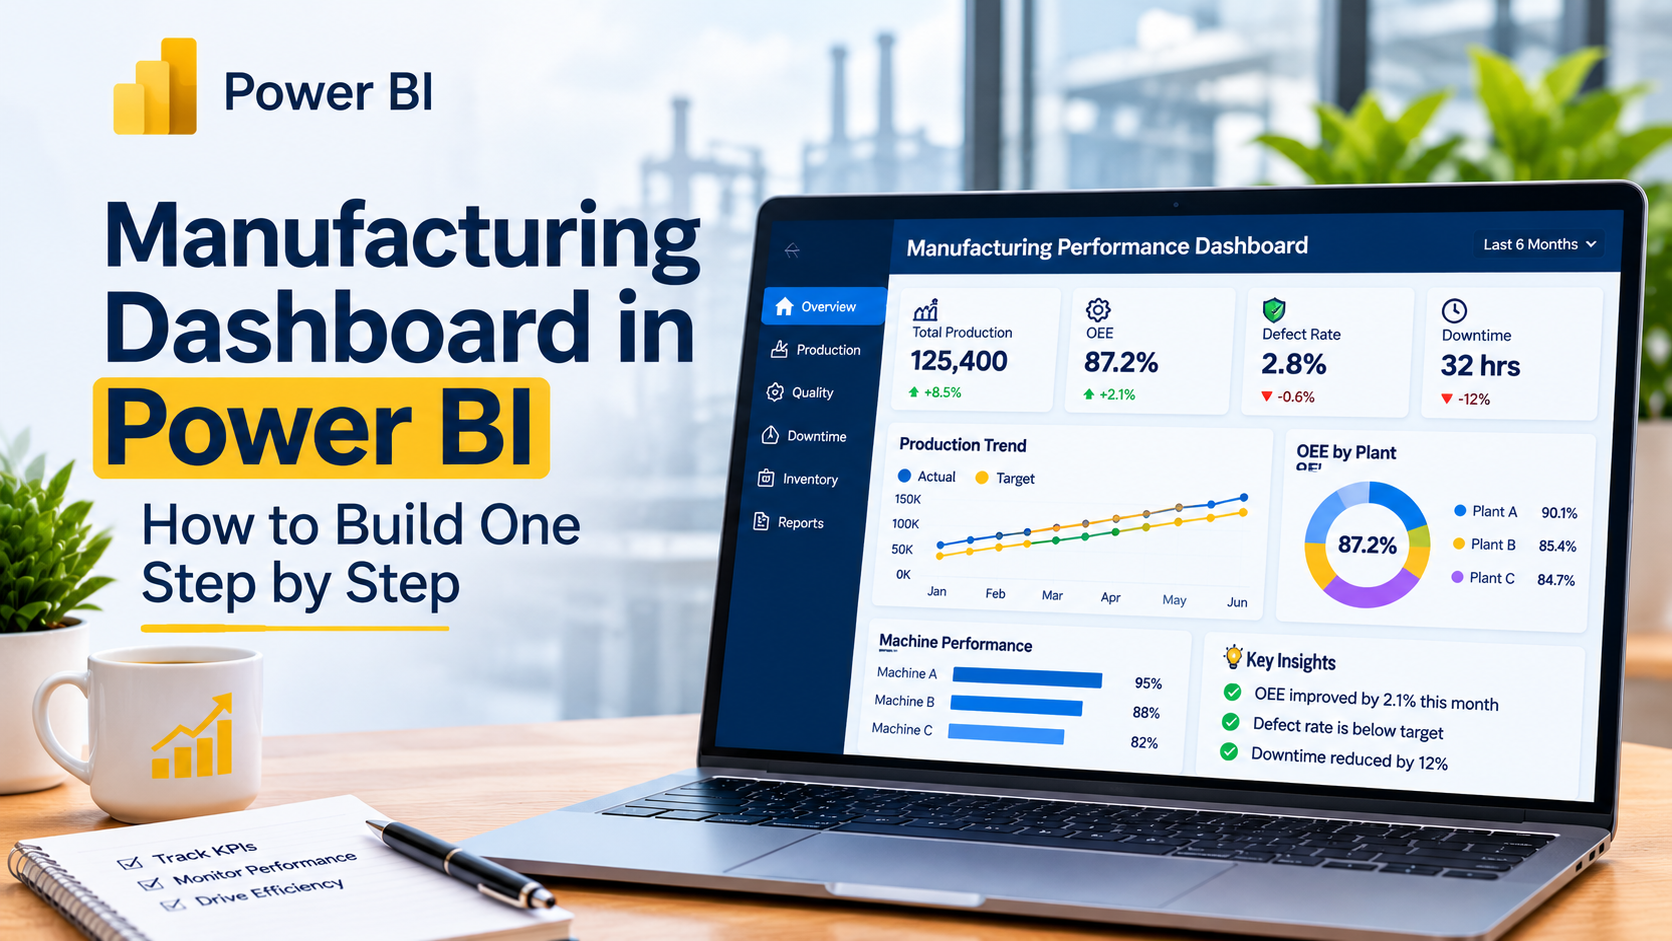
Manufacturing teams work with data from production lines, machines, inventory systems, quality checks, maintenance records, and spreadsheets. When this information sits in separate files, managers often struggle to understand what is happening across the factory.
A Power BI manufacturing dashboard brings these data sources together and turns them into useful visual reports. It helps production managers identify delays, compare actual output with targets, monitor equipment efficiency, and make better operational decisions.
Let's understand how to build one step by step.
What Is a Manufacturing Dashboard in Power BI?
A manufacturing dashboard in Power BI is a visual reporting solution that combines factory data to track production, equipment, quality, inventory, and cost performance.
For example, a plant manager can use it to check:
- How many units did the factory produce today?
- Which production line missed its target?
- How much time did machines remain idle?
- What percentage of products failed quality checks?
- Are raw materials available for upcoming production?
- Which shift achieved the best output?
Instead of checking multiple Excel sheets, managers can use interactive reports to explore performance by date, plant, product, machine, production line, or shift.
Important: Power BI Desktop is used to build reports. Power BI Service also provides single-page dashboards, where users can pin important visuals from reports. In everyday business conversations, people often use the word "dashboard" for both. Microsoft explains the difference between Power BI reports and dashboards here.
Why Do Manufacturing Companies Need Power BI Dashboards?
Manufacturing operations generate large amounts of data every day. A well-designed dashboard makes this information easier to understand and act on.
| Business challenge | What a Power BI dashboard helps monitor |
|---|---|
| Production delays | Planned vs actual production |
| Machine breakdowns | Downtime and machine availability |
| Quality problems | Defect rate and rejection trends |
| High operating costs | Material, labour and energy costs |
| Inventory shortages | Stock levels and material consumption |
| Poor shift performance | Output and efficiency by shift |
The main benefits include:
- Better production visibility: Compare output across machines, shifts, products, and plants.
- Faster problem identification: Find production lines with unusual downtime or high rejection rates.
- Improved quality monitoring: Track defects and identify recurring quality issues.
- Better inventory planning: Monitor stock levels and material usage.
- Reduced manual reporting: Replace repetitive spreadsheet consolidation with a repeatable reporting process.
A dashboard does not automatically fix production problems. It gives teams better information so they can investigate the cause and take action.
Which KPIs Should a Manufacturing Dashboard Include?
The right manufacturing KPIs depend on the plant, production process, and business goals. Start with a small group of measures that help managers understand output, equipment, quality, and cost.
| KPI | What it measures | Why it matters |
|---|---|---|
| Production Output | Units produced during a period | Tracks manufacturing volume |
| Production Achievement | Actual output compared with target | Shows target performance |
| OEE | Availability × Performance × Quality | Measures overall equipment effectiveness |
| Machine Downtime | Time equipment remains unavailable | Highlights production losses |
| Defect Rate | Defective units as a share of inspected units | Monitors product quality |
| First Pass Yield | Units passing without rework divided by units entering the process | Measures process quality |
| Scrap Rate | Scrapped material or units as a share of total input | Helps identify waste |
| Inventory Turnover | How frequently inventory is used or sold over a period | Supports inventory planning |
| Production Cost per Unit | Production cost divided by units produced | Tracks unit economics |
What Is OEE in Manufacturing?
Overall Equipment Effectiveness (OEE) measures how effectively a manufacturing machine or production line operates. It combines three factors:
- Availability: How much of the planned production time the equipment was running.
- Performance: How closely the equipment operated against its expected production speed.
- Quality: The proportion of total units produced that met quality requirements.
The standard calculation is:
OEE = Availability × Performance × Quality
For example, if availability is 90%, performance is 95%, and quality is 98%:
OEE = 0.90 × 0.95 × 0.98 = 83.79%
A Power BI OEE dashboard can show the overall result and allow managers to investigate which factor is reducing performance.
What Data Do You Need to Build a Manufacturing Dashboard?
Before opening Power BI, identify where the factory stores its operational information.
| Data source | Typical information | Possible dashboard use |
|---|---|---|
| Excel / CSV files | Daily production and shift reports | Output and target tracking |
| ERP system | Orders, material, procurement and costs | Inventory and cost analysis |
| MES | Production events, machine activity and output | Production performance |
| Maintenance / CMMS | Breakdown records and work orders | Downtime analysis |
| Quality system | Inspection and rejection records | Defect and quality analysis |
| SQL database | Structured operational records | Combined reporting model |
You do not need every system to build your first dashboard. A clean Excel production file can be enough for a useful prototype.
For a larger factory, the reporting model may need data from ERP, MES, inventory, and maintenance systems. The availability of connectors, access permissions, data quality, and refresh requirements will affect the implementation.
How to Create a Manufacturing Dashboard in Power BI: Step by Step
Follow these steps to build a practical manufacturing KPI dashboard.
Step 1: Define the Purpose of the Dashboard
Start by understanding who will use the report and what decisions they need to make.
For example:
- Plant managers may need overall production and cost performance.
- Production supervisors may need shift-wise output and target tracking.
- Maintenance teams may need machine downtime and breakdown analysis.
- Quality teams may need rejection rates and defect trends.
- Inventory teams may need stock availability and material consumption.
Do not put every available metric on one page. Choose KPIs based on the user's responsibilities.
Step 2: Connect Your Manufacturing Data
Open Power BI Desktop and select Home → Get Data.
Choose the source that contains your factory information, such as:
- Excel workbook
- CSV file
- SQL Server
- SharePoint
- Other supported business systems
For a beginner project, start with a production file containing columns such as:
| Date | Machine | Shift | Product | Target Qty | Actual Qty | Defect Qty | Downtime (Min) |
|---|---|---|---|---|---|---|---|
| 01-Nov | M01 | A | Product A | 1,000 | 920 | 20 | 45 |
| 01-Nov | M02 | B | Product B | 800 | 780 | 12 | 30 |
| 02-Nov | M01 | A | Product A | 1,000 | 960 | 15 | 20 |
This sample structure gives you a starting point for production, quality, and downtime analysis.
Step 3: Clean the Data Using Power Query
Raw manufacturing data may contain duplicate records, missing values, inconsistent machine names, and incorrect date formats.
Open Transform Data to access Power Query Editor.
Perform these checks:
- Set the correct data types for dates, numbers, and text.
- Remove duplicate records only after confirming what makes a record unique.
- Standardise machine, product, and shift names.
- Check blank values in production and downtime columns.
- Combine monthly or shift-wise files when their structures match.
- Check whether production targets and actual quantities use the same unit.
For a deeper explanation, read TechnoExcel's Power Query in Power BI beginner's guide.
Expert tip: Do not delete missing production values automatically. A blank value may indicate a missing report, an inactive machine, or an incomplete shift record. Confirm its meaning with the data owner first.
Step 4: Create a Proper Data Model
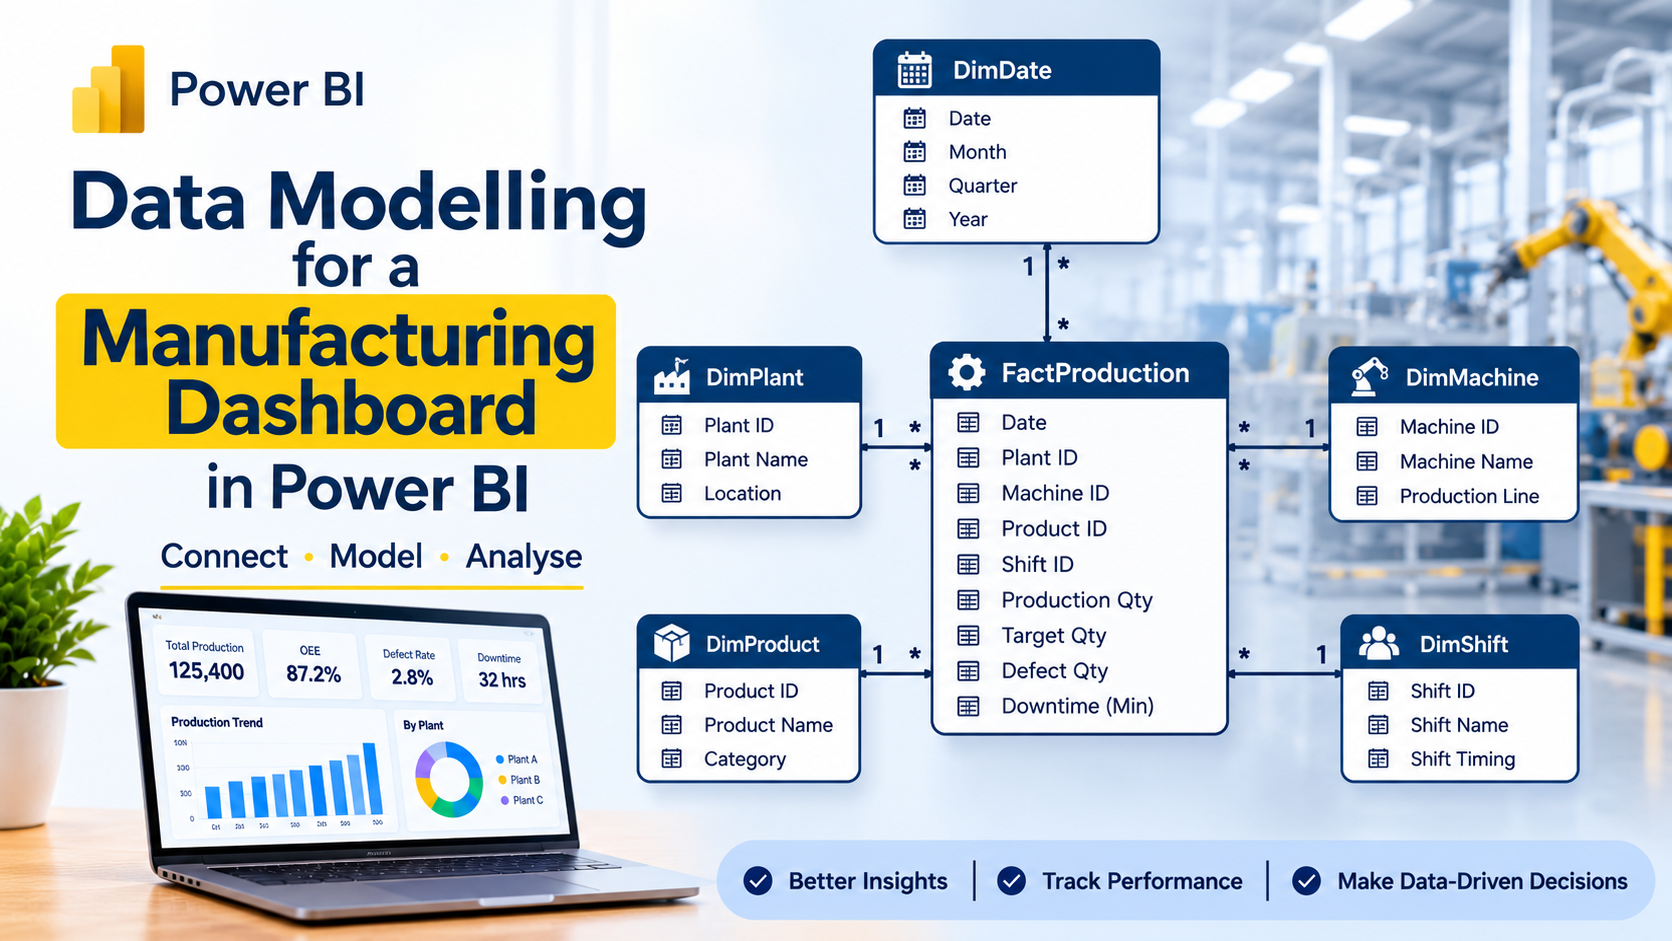
Once the data is clean, create relationships between the tables.
A useful manufacturing data model may include:
- FactProduction: Production date, machine, product, shift, target quantity, and actual quantity.
- FactQuality: Inspection quantity, defective quantity, and rejection reason.
- FactDowntime: Machine, downtime duration, event date, and breakdown reason.
- DimDate: Date, month, quarter, and year.
- DimMachine: Machine name, machine ID, and production line.
- DimProduct: Product name and product category.
- DimShift: Shift name and shift timing.
Use a star schema where suitable: fact tables store business events and numeric values, while dimension tables provide fields for filtering and grouping. Microsoft recommends star-schema principles for Power BI semantic models.
Read Microsoft's guide to star schema in Power BI before building a larger reporting model.
Step 5: Create Manufacturing KPI Measures Using DAX
DAX measures calculate business metrics from your data model. Start with simple measures and verify their results against the original source.
Total Production
Total Production =
SUM(FactProduction[Actual Qty])
Production Target
Production Target =
SUM(FactProduction[Target Qty])
Production Achievement %
Production Achievement % =
DIVIDE(
[Total Production],
[Production Target],
0
)
Total Defects
Total Defects =
SUM(FactQuality[Defect Qty])
Defect Rate %
Defect Rate % =
DIVIDE(
[Total Defects],
[Total Inspected Qty],
0
)
Total Downtime (Minutes)
Total Downtime =
SUM(FactDowntime[Downtime Min])
These examples assume that the tables and column names match your model. You must define the correct business rules, inspection denominator, time period, and production grain before using them in a live report.
OEE needs additional data, including planned production time, actual run time, ideal cycle time, and good units. Do not calculate OEE from production output and downtime alone unless the required definitions and assumptions are available.
Step 6: Design the Manufacturing Dashboard
A useful manufacturing report should help users understand performance quickly.
Consider creating these report pages:
| Report page | Suggested visuals | Main purpose |
|---|---|---|
| Production Overview | KPI cards, target vs actual chart, production trend | Overall plant performance |
| Machine Performance | Machine comparison, downtime chart, OEE breakdown | Identify equipment problems |
| Quality Analysis | Defect trend, rejection reasons, product comparison | Monitor quality issues |
| Inventory Overview | Stock levels, material consumption, reorder status | Track material availability |
| Shift Performance | Shift-wise output, achievement and downtime | Compare shift performance |
Use slicers for:
- Date range
- Plant or production unit
- Machine
- Product
- Production line
- Shift
Keep the most important KPIs near the top. Use trend charts to show changes over time and bar charts to compare machines or production lines.
Step 7: Publish and Configure Data Refresh
After validating your report, publish it to Power BI Service.
Configure the refresh process based on the data source and how frequently the information changes. Import-mode models need data refreshes to retrieve updated source data. DirectQuery works differently because queries are sent to the underlying source.
For on-premises data sources, you may need an on-premises data gateway. Test the refresh process, credentials, and permissions before sharing the report with factory teams.
Follow Microsoft's Power BI data refresh documentation for the relevant configuration.
Remember: a scheduled refresh does not automatically make every report real-time. Clearly communicate the last successful refresh time to dashboard users.
Common Mistakes to Avoid When Building a Manufacturing Dashboard
| Mistake | Why it creates problems | What to do instead |
|---|---|---|
| Tracking too many KPIs | Users struggle to find important information | Start with decision-focused metrics |
| Using inconsistent machine names | Filters and comparisons become unreliable | Standardise machine IDs |
| Ignoring data quality | Incorrect inputs produce misleading results | Validate source records |
| Using an incorrect OEE formula | Equipment performance may be misrepresented | Define availability, performance and quality correctly |
| Building a flat, poorly structured model | Measures may become difficult to maintain | Use fact and dimension tables |
| Ignoring refresh failures | Users may make decisions using old data | Monitor refresh history |
| Showing numbers without context | Managers cannot judge whether results are good or bad | Add targets, comparisons and trends |
Frequently Asked Questions
1. What is a manufacturing dashboard in Power BI?
It is an interactive reporting solution that helps manufacturers monitor production, machine performance, quality, inventory, and operational costs using data from sources such as Excel, ERP, MES, and SQL databases.
2. Which KPIs should a manufacturing dashboard include?
Common KPIs include production output, production achievement, OEE, machine downtime, defect rate, first pass yield, scrap rate, inventory turnover, and production cost per unit. Select metrics based on the decisions your teams need to make.
3. Can Power BI track production in real time?
Power BI can support frequently updated reporting, but actual data freshness depends on the source system, connection mode, refresh configuration, and architecture. Do not describe a scheduled-refresh report as real-time unless its data pipeline supports that requirement.
4. Can I create a manufacturing dashboard using Excel data?
Yes. You can import Excel production reports into Power BI, clean them using Power Query, create DAX measures, and build interactive reports. Excel is a practical starting point for a small manufacturing dashboard.
5. How do I calculate OEE in Power BI?
OEE is calculated by multiplying Availability, Performance, and Quality. You need reliable production-time, operating-time, ideal-cycle-time, total-output, and good-output data to calculate it correctly.
6. What is the difference between a production dashboard and a manufacturing dashboard?
A production dashboard mainly focuses on output, production targets, machine performance, and shift efficiency. A manufacturing dashboard can cover a wider range of operations, including production, quality, maintenance, inventory, supply chain, and costs.
7. Can Power BI connect to ERP and MES systems?
Power BI can connect to supported databases, files, and business systems through available connectors or other integration methods. The exact approach depends on the ERP or MES platform, permissions, data architecture, and connector support.
8. Is Power BI suitable for small manufacturing companies?
Yes. Smaller manufacturers can start with Excel or CSV production data and gradually expand their reporting model as their data systems and reporting needs grow. The important thing is to begin with reliable data and clearly defined KPIs.
9. Can a Power BI manufacturing dashboard show machine downtime?
Yes. If machine downtime records contain machine IDs, event dates, start and end times, and downtime reasons, Power BI can calculate downtime duration and display breakdown trends by machine, line, or shift.
10. How can I learn to build manufacturing dashboards in Power BI?
Start with Power Query, data modelling, DAX, and report design. Then practise with production, inventory, and quality datasets. You can also explore structured Power BI Mastery training at TechnoExcel.
Final Thoughts
A manufacturing dashboard in Power BI helps turn scattered factory data into information that production, quality, maintenance, and management teams can use.
Start with a few important KPIs, prepare your data carefully, build a reliable model, and design report pages around real operational decisions. As your reporting needs grow, you can connect more systems and introduce deeper analysis.
If you want to build practical Power BI skills covering Power Query, DAX, data modelling, and dashboard development, explore TechnoExcel's Power BI Mastery programme. For organisations looking to improve team reporting skills, TechnoExcel also offers corporate training built around actual business data and KPIs.
This topic is covered in the Power BI Mastery course. Sessions are live, practical and taught with real business data — a natural next step if this article matches what you are working on.