Power BI KPIs: Build an Interactive KPI Dashboard
A Power BI KPI dashboard helps businesses track important performance indicators against specific targets. To create one, prepare your data, build a data model, write DAX measures for actual performance and targets, choose suitable visuals, and add filters so users can explore results.
What Is a KPI Dashboard in Power BI?
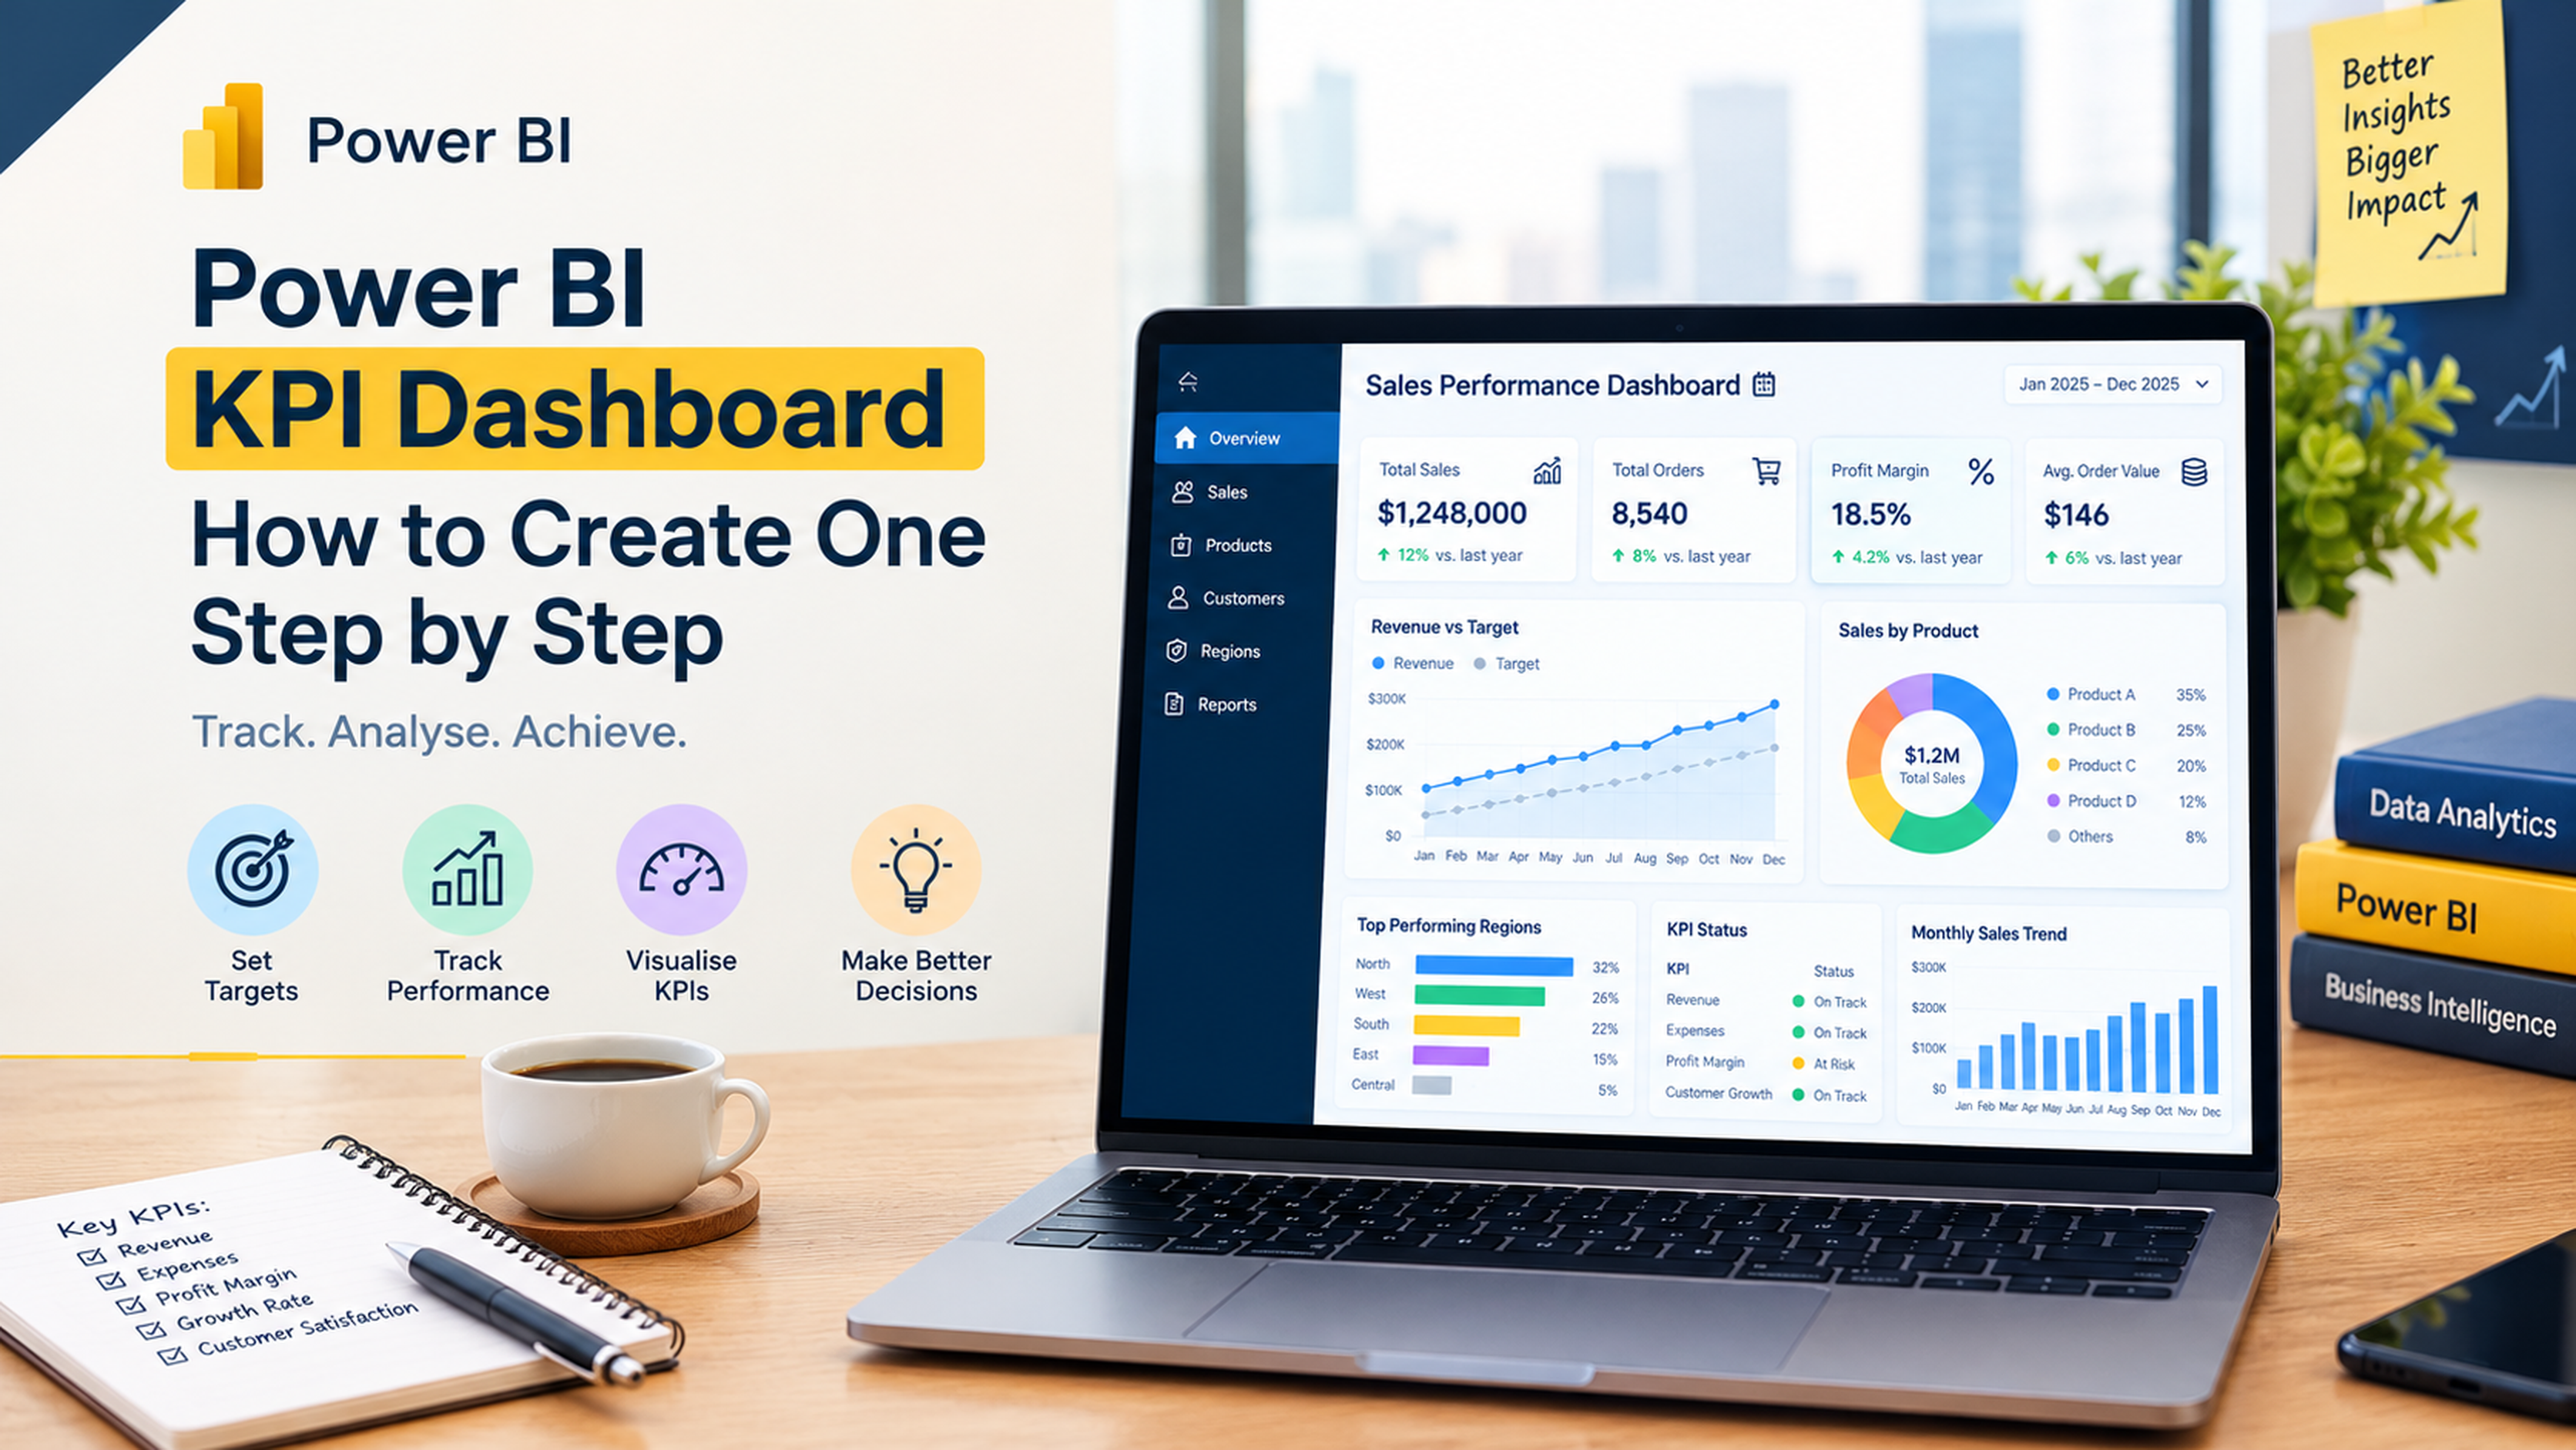
A KPI dashboard in Power BI is an interactive report that shows whether a business is achieving its important goals. It brings key metrics, target values, performance trends, and status indicators together in one place.
For example, a sales manager can use a KPI dashboard to monitor monthly revenue, sales growth, target achievement, and regional performance. Instead of checking multiple spreadsheets, the manager can quickly see which areas are meeting expectations and which need attention.
A useful KPI dashboard should answer three questions:
- What is our current performance?
- What target are we trying to achieve?
- Are we moving in the right direction?
A KPI is not just a number on a card. It needs a clear business purpose, a reliable calculation, and a target or benchmark that helps users interpret the result.
KPI vs Metric vs Target: What Is the Difference?
These terms are related, but they do not mean the same thing.
| Term | Meaning | Example |
|---|---|---|
| Metric | A measurable business value | Monthly sales |
| KPI | A metric linked to an important business objective | Monthly sales target achievement |
| Target | The desired performance level | ₹10 lakh monthly sales |
| Actual | The result achieved | ₹8.5 lakh sales |
| Variance | Difference between actual and target | -₹1.5 lakh |
For example, total website visitors may be a metric. If the business wants to increase qualified leads, the conversion rate may be a more relevant KPI.
The best KPIs are linked to business goals, not simply selected because they are easy to display.
Why Should You Create a KPI Dashboard in Power BI?
Power BI helps teams monitor performance through interactive reports that connect business data with calculations and visualisations.
Key benefits include:
- Performance tracking: Compare actual results with business targets.
- Faster reporting: Bring data from multiple sources into one report.
- Trend analysis: Understand how performance changes over time.
- Better decisions: Identify weak areas that need attention.
- Interactive analysis: Filter KPIs by department, region, product, or reporting period.
- Consistent monitoring: Reuse measures and report layouts instead of manually rebuilding calculations.
For example, a sales team can track monthly revenue, conversion rate, new customers, and target achievement in one dashboard.
Which KPIs Should You Include in a Power BI Dashboard?
Choose KPIs according to the business function and the decisions users need to make.
| Department | Example KPIs | What they help monitor |
|---|---|---|
| Sales | Revenue, conversion rate, target achievement | Sales performance |
| Finance | Profit margin, expenses, budget variance | Financial health |
| HR | Headcount, attrition, employee retention | Workforce performance |
| Marketing | Leads, cost per lead, conversion rate | Campaign effectiveness |
| Operations | Production output, defect rate, delivery time | Operational efficiency |
| Customer Service | Resolution time, customer satisfaction | Service quality |
Do not put every available metric on one page. Start with a small group of high-value KPIs and add more only when they support a clear business question.
What Data Do You Need to Create a KPI Dashboard?
For a basic sales KPI dashboard, you can start with an Excel file containing the following fields:
| Column | Purpose |
|---|---|
| Date | Transaction or reporting date |
| Salesperson | Person responsible for the sale |
| Region | Sales location |
| Product | Product category |
| SalesAmount | Actual sales value |
| SalesTarget | Target sales value |
You can also maintain a separate target table if targets vary by salesperson, region, or month.
Before importing the data, check that dates use a consistent format, sales amounts are numeric, and each salesperson or region has the correct target. If actuals and targets are stored at different levels of detail, model them carefully before comparing them.
How to Create a KPI Dashboard in Power BI
Step 1: Import Your Data
Open Power BI Desktop and select Home → Get Data.
Choose Excel, CSV, SQL Server, or another supported source. Import your actual sales data and target data.
Check the column names and data types. Dates should be dates, sales values should be numeric, and category fields should be text.
If you need help preparing multiple files or cleaning inconsistent records, read TechnoExcel's Power Query in Power BI beginner's guide.
Step 2: Clean and Prepare Data Using Power Query
Select Transform Data to open Power Query Editor.
Complete these checks:
- Remove unnecessary columns.
- Correct incorrect data types.
- Check for duplicate transaction records.
- Standardise region and product names.
- Investigate blank sales values.
- Make sure target values are mapped to the correct reporting period.
Do not delete every duplicate automatically. Two transactions can have identical values and still be valid records. Use transaction IDs or other business rules to identify genuine duplicates.
Step 3: Build the Data Model
Create relationships between your sales table, target table, date table, and relevant dimension tables.
A simple model may contain:
- Sales table: Actual transaction values.
- Targets table: Planned performance values.
- Date table: Year, quarter, month, and date.
- Region table: Region names and identifiers.
- Product table: Product categories.
A well-designed model helps filters work consistently and reduces the risk of incorrect totals. Microsoft's Power BI star schema guidance explains how fact and dimension tables support effective semantic models.
Step 4: Create KPI Measures Using DAX
DAX measures calculate values dynamically when users apply filters.
Assume your table is named Sales and contains a numeric column called SalesAmount.
Total Sales
Total Sales =
SUM(Sales[SalesAmount])
Sales Target
If the target table is named Targets and has a numeric column called TargetAmount:
Sales Target =
SUM(Targets[TargetAmount])
This assumes the target table is related correctly to the relevant date and business dimensions.
Target Variance
Target Variance =
[Total Sales] - [Sales Target]
Target Achievement Percentage
Target Achievement % =
DIVIDE(
[Total Sales],
[Sales Target],
0
)
Format this measure as a percentage.
KPI Status
KPI Status =
SWITCH(
TRUE(),
[Target Achievement %] >= 1, "Target Achieved",
[Target Achievement %] >= 0.8, "Near Target",
"Below Target"
)
These thresholds are examples. Adjust them to match the organisation's actual performance rules.
If you want to strengthen your DAX knowledge, explore TechnoExcel's Power BI interview questions and answers, which cover measures, filter context, data modeling, and other important Power BI concepts.
Step 5: Choose the Right KPI Visuals
Power BI provides several visuals for displaying performance information. Choose them according to the question you want to answer.
| Visual | Best use |
|---|---|
| Card | Display a single value, such as total sales |
| KPI visual | Compare actual performance with a target over time |
| Gauge | Show progress toward a defined goal |
| Line chart | Track performance trends |
| Bar chart | Compare regions, products, or departments |
| Matrix | Display detailed KPI results by category |
A KPI visual is especially useful when you have a base measure, a target, and a trend axis. Microsoft explains these requirements in its official guide to creating KPI visualisations.
Do not use a gauge for every KPI. Cards and simple charts may communicate the result more clearly when users only need to compare values.
Step 6: Design the Dashboard Layout
A practical sales KPI dashboard can use the following layout.
Top section: KPI cards
- Total Sales
- Sales Target
- Target Achievement %
- Target Variance
Middle section: Performance analysis
- Monthly sales trend
- Actual versus target chart
- Sales by region
Bottom section: Detailed analysis
- Sales by product
- Salesperson performance
- Monthly KPI status
Keep the most important information at the top. Use consistent number formats, clear chart titles, and colours that communicate performance without distracting users.
For more dashboard design ideas, browse TechnoExcel's Power BI and analytics articles.
Step 7: Add Slicers and Interactive Filters
Add slicers for:
- Year and month
- Region
- Product
- Salesperson
These filters allow users to investigate performance without creating a separate report for every category.
Test the visual interactions carefully. For example, selecting a region should update the relevant sales and target calculations consistently.
Step 8: Validate and Publish Your Dashboard
Before publishing, compare the report with the original sales and target records.
Check that:
- Actual sales match the source data.
- Targets are assigned to the correct period.
- Achievement percentages use the correct denominator.
- Blank or missing values do not distort the results.
- Filters work as expected.
- Users can access only the information they are authorised to view.
Once the report is ready, publish it to Power BI Service and configure refresh settings based on your data source and access requirements.
Common KPI Dashboard Mistakes to Avoid
| Mistake | Better approach |
|---|---|
| Tracking too many KPIs | Focus on business-critical measures |
| Using unclear targets | Define measurable and realistic targets |
| Ignoring data quality | Validate source data before reporting |
| Choosing the wrong visual | Match the visual to the business question |
| Using misleading colours | Define clear performance thresholds |
| Comparing incompatible periods | Align actuals and targets by reporting period |
| Publishing without testing | Validate measures and filters before sharing |
Frequently Asked Questions
1. What is a KPI dashboard in Power BI?
A KPI dashboard in Power BI is an interactive report that tracks key business metrics against defined targets. It helps users monitor performance, identify trends, and understand where results are above or below expectations.
2. How do I create a KPI in Power BI?
Import and prepare your data, create a DAX measure for the actual value, define a target measure, and select a suitable visual. For the native KPI visual, configure the indicator, trend axis, and target fields.
3. What is the difference between a Power BI card and a KPI visual?
A card displays a value, such as total sales. A KPI visual compares a current value with a target and can show a trend over time. Use a card for a headline number and a KPI visual when progress toward a goal matters.
4. Can I create a KPI dashboard in Power BI without DAX?
Yes. You can build basic reports using columns and built-in aggregations. However, DAX measures provide more control over calculations such as target achievement, variance, growth, and time-based comparisons.
5. How do I calculate KPI achievement percentage in Power BI?
Divide the actual value by the target value using the DAX DIVIDE function. For example, DIVIDE([Actual Sales], [Sales Target], 0) calculates achievement while handling a zero denominator safely.
6. Which visuals are best for a KPI dashboard?
Cards are useful for headline values, KPI visuals compare actuals with targets, gauges show progress, line charts show trends, and bar charts compare categories. Choose visuals based on the decision users need to make.
7. Can I create a KPI dashboard using Excel data?
Yes. Power BI can import Excel data and use Power Query to clean it. You can then create relationships, write DAX measures, and build an interactive dashboard.
8. Can a Power BI KPI dashboard be refreshed automatically?
Yes, if the source connection, credentials, gateway requirements, and refresh configuration support it. Test the refresh process and confirm that updated source data appears correctly in the report.
Conclusion
A good Power BI KPI dashboard does more than display business numbers. It connects performance measures with clear targets, useful trends, and the information people need to make decisions.
Start with a few meaningful KPIs, prepare your data carefully, create reliable DAX measures, and choose visuals that explain performance clearly. As your reporting needs grow, you can expand the dashboard with additional departments, targets, and analysis.
Want to build practical Power BI skills? Explore TechnoExcel's Power BI Mastery training to learn Power Query, data modeling, DAX, dashboard design, and Power BI Service through hands-on exercises.
This topic is covered in the Power BI Mastery course. Sessions are live, practical and taught with real business data — a natural next step if this article matches what you are working on.