How to Create an HR Dashboard in Power BI (Step-by-Step)
An HR dashboard in Power BI helps HR teams track employee headcount, hiring, attrition, retention, department performance, and workforce trends in one interactive report. To create one, prepare your employee data, clean it in Power Query, build a data model, create DAX measures, choose relevant visuals, and add slicers for interactive analysis. The most useful HR dashboard focuses on business decisions, not just charts.
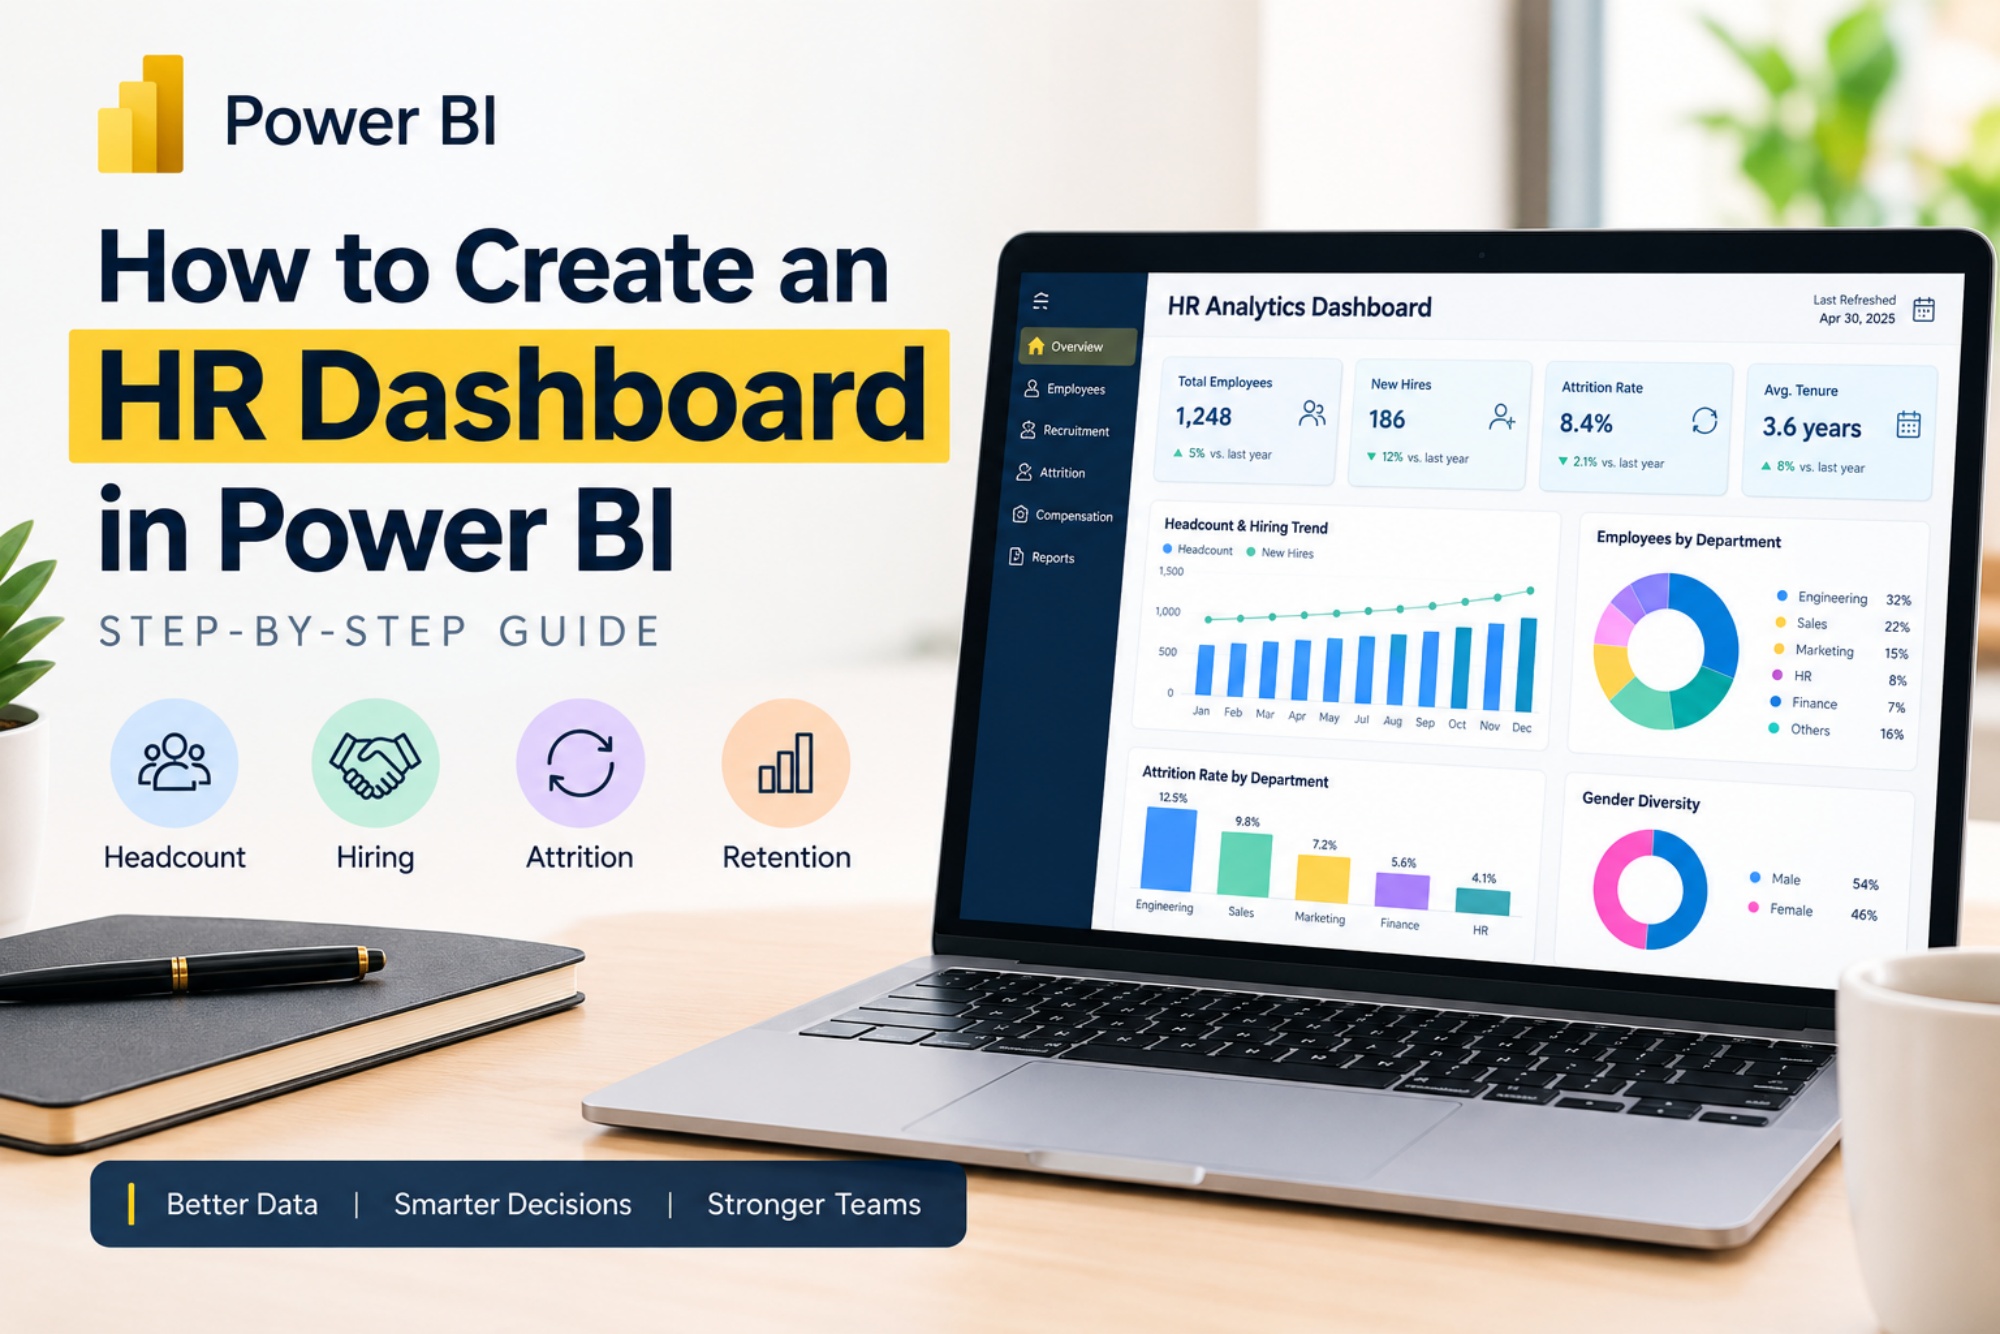
What Is an HR Dashboard in Power BI?
An HR dashboard in Power BI is an interactive report that converts employee data into meaningful workforce insights. Instead of maintaining separate Excel files for recruitment, employee exits, attendance, and department reports, HR teams can bring relevant data together and monitor important metrics in one place.
For example, an HR manager can use a dashboard to understand which departments have the highest attrition, how hiring has changed over time, or whether employee turnover is increasing in a particular location.
A well-designed dashboard helps HR teams move from basic reporting to data-driven workforce planning.
If you want to understand the broader process of building business dashboards, explore Power BI Mastery training at TechnoExcel, which covers data modeling, DAX, report design, and Power BI Service.
Why Should HR Teams Use Power BI?
Traditional HR reports often require manual data consolidation and repeated updates. Power BI can make this process more structured by connecting data sources, transforming information, and refreshing reports when configured appropriately.
Key benefits include:
- Workforce visibility: Monitor headcount, employee distribution, and department strength.
- Recruitment analysis: Track new hires and hiring trends over time.
- Attrition monitoring: Identify employee turnover patterns across departments and locations.
- Better workforce planning: Understand staffing trends and potential resource gaps.
- Interactive reporting: Filter information by department, location, job role, or time period.
- Reduced manual reporting: Automate parts of the reporting process through reusable data transformations and scheduled refreshes.
However, a dashboard is only as reliable as the data and metric definitions behind it. HR teams should agree on how each KPI is calculated before presenting results to management.
Which KPIs Should an HR Dashboard Include?
Start with metrics that answer specific HR questions. You do not need to include every available metric on the first page.
| HR KPI | What it tells you |
|---|---|
| Total headcount | Number of employees at a selected point in time |
| New hires | Employees who joined during a selected period |
| Employee exits | Employees who left during a selected period |
| Attrition rate | Proportion of the workforce leaving during a defined period |
| Average tenure | How long employees have worked for the organisation |
| Department headcount | Employee distribution across departments |
| Time to hire | Time taken to fill a position, based on an agreed definition |
| Absenteeism rate | Employee absence relative to a defined working-time measure |
Choose KPIs according to your organisation's needs. For example, a recruitment-focused dashboard may prioritise time to hire and hiring pipeline metrics, while a workforce planning dashboard may focus on headcount, attrition, and department-level trends.
What Data Do You Need to Create an HR Dashboard?
Before opening Power BI, organise your employee data in a structured table. You can start with Excel or connect to an approved HR system or database.
A basic employee dataset may contain these fields:
| Column | Purpose |
|---|---|
| EmployeeID | Unique employee identifier |
| Department | Employee's department |
| JobRole | Employee's role |
| Location | Office or work location |
| HireDate | Employee joining date |
| ExitDate | Employee leaving date, if applicable |
| EmploymentStatus | Active or inactive status |
| Salary | Compensation, if required for analysis |
For recruitment analysis, you may also need a separate recruitment table containing requisition dates, application stages, offer dates, and joining dates.
Important: Keep employee identifiers consistent, check for duplicate records, and define whether each row represents a person, an employment event, or a snapshot. This decision affects how your measures should be calculated.
HR data can contain confidential personal information. Use only the fields required for analysis, restrict access appropriately, and avoid exposing individual salary or employee details to unauthorised users.
How to Create an HR Dashboard in Power BI
Step 1: Import Your HR Data
Open Power BI Desktop and select Get Data. Choose the relevant source, such as Excel, CSV, SQL Server, or another supported data source.
Load a sample employee dataset first if you are learning. Check whether the columns have been recognised correctly and whether dates, numbers, and text fields have appropriate data types.
If your organisation stores employee information across several files, identify how the files relate to one another before combining them.
Step 2: Clean the Data Using Power Query
Select Transform Data to open Power Query Editor.
Complete the following checks:
- Remove duplicate employee records where appropriate.
- Standardise department and location names.
- Correct data types for dates, salaries, and identifiers.
- Handle missing values without automatically treating every blank as zero.
- Check that exit dates are valid and consistent with employment status.
- Remove unnecessary columns containing sensitive or irrelevant information.
For example, “Human Resources,” “HR,” and “Human Resource” should not appear as three different departments if they refer to the same team.
Power Query allows you to save transformation steps and reuse them during refreshes. For a deeper understanding of this process, read TechnoExcel's guide to Power Query in Power BI.
Step 3: Build the Data Model
A reliable data model makes HR calculations easier to maintain and helps prevent incorrect totals.
For a simple dashboard, you might use:
- An Employees table for employee attributes.
- A Calendar table for dates.
- A Recruitment table for hiring activity, if required.
- An Attendance table for absence analysis, if required.
Create relationships based on the actual structure of your data. A calendar table can support time-based analysis, but hiring dates and exit dates may require separate date relationships or measures that activate the appropriate relationship.
Avoid creating unnecessary relationships between tables simply because they share a column name.
If you are developing more advanced reports, TechnoExcel's Power BI developer roadmap explains the importance of data modeling, DAX, dashboard projects, and deployment skills.
Step 4: Create HR KPI Measures Using DAX
DAX measures calculate metrics dynamically as users filter the dashboard. The following examples illustrate the basic approach.
Distinct employees
Employee Records =
DISTINCTCOUNT(Employees[EmployeeID])
Use this measure only when the employee records and reporting context make a distinct employee count appropriate. It does not automatically calculate historical headcount at any selected date.
- New hires
Assume the Calendar table has an inactive relationship with Employees[HireDate].
New Hires =
CALCULATE(
DISTINCTCOUNT(Employees[EmployeeID]),
USERELATIONSHIP(
'Calendar'[Date],
Employees[HireDate]
)
)- Employee exits
Assume the Calendar table has an inactive relationship with Employees[ExitDate].
Employee Exits =
CALCULATE(
DISTINCTCOUNT(Employees[EmployeeID]),
USERELATIONSHIP(
'Calendar'[Date],
Employees[ExitDate]
)
)- Attrition rate
Attrition Rate =
DIVIDE(
[Employee Exits],
[Average Headcount],
0
)
This measure requires a correctly defined [Average Headcount] measure and an agreed attrition methodology. Organisations may use different definitions, such as average monthly headcount or opening-period headcount. Document your chosen method and apply it consistently.
DAX calculations can become more complex when employees have multiple employment periods or when the dashboard must show historical headcount. Validate measures against known HR totals before publishing.
For more practice, refer to TechnoExcel's Power BI interview questions and answers guide, which covers concepts relevant to Power BI development.
Step 5: Design the HR Dashboard Layout
Organise the report so that users can understand the workforce situation quickly.
A practical layout could include:
Top row: KPI cards
- Total headcount
- New hires
- Employee exits
- Attrition rate
Middle section: Workforce trends
- Line chart showing headcount over time
- Bar chart comparing headcount by department
- Column chart showing monthly hires and exits
Bottom section: Workforce breakdown
- Employee distribution by location
- Employee tenure distribution
- Department-level attrition comparison
Use chart types that suit the question being answered. For example, a line chart works well for trends over time, while a bar chart makes department comparisons easier.
Keep the layout clean, use consistent colours, and avoid filling every available space with a visual. If you want to improve your report layout further, explore TechnoExcel's Power BI and analytics learning resources.
Step 6: Add Slicers and Interactive Filters
Slicers allow HR managers to explore the data without needing separate reports for every department or location.
Useful slicers include:
- Date or reporting period
- Department
- Location
- Job role
- Employment status
Check that each slicer filters the intended visuals. Review the relationships and visual interactions if some charts do not respond correctly.
Where sensitive information is involved, remember that hiding a visual or adding a slicer is not a substitute for properly configured access controls.
Step 7: Validate and Publish the Dashboard
Before sharing your dashboard, compare its figures with trusted HR reports or source-system totals.
Check that:
- Headcount matches the agreed reporting definition.
- New hires and exits fall within the selected dates.
- Attrition calculations use the approved formula.
- Blank or invalid dates do not distort the results.
- Filters and slicers work as intended.
- Users can access only the data they are authorised to see.
When the report is ready, publish it to Power BI Service and configure refresh settings according to your data source and organisational requirements. Review workspace permissions and row-level security where appropriate.
Common Mistakes to Avoid
| Mistake | How to avoid it |
|---|---|
| Showing too many KPIs | Focus on the questions HR leaders need answered |
| Using inconsistent employee records | Define the grain of each table and validate employee IDs |
| Calculating attrition incorrectly | Document the numerator, denominator, and reporting period |
| Mixing hiring and exit dates | Model date relationships carefully |
| Using too many visuals | Keep the report focused and easy to scan |
| Ignoring data privacy | Restrict sensitive fields and configure appropriate access |
| Publishing without validation | Compare measures with trusted source reports |
Frequently Asked Questions
1. Can I create an HR dashboard in Power BI using Excel data?
Yes. You can import employee data from Excel, clean it in Power Query, build the data model, create DAX measures, and design interactive reports.
2. Which KPIs are most important in an HR dashboard?
Start with headcount, new hires, exits, attrition rate, and department distribution. Add recruitment, absenteeism, tenure, or compensation metrics based on your reporting goals and data availability.
3. Is coding required to create an HR dashboard in Power BI?
You can create basic reports using the Power BI interface. However, DAX is useful for calculating KPIs, while Power Query helps automate data preparation. More complex dashboards may require advanced modeling and calculations.
4. Can Power BI show employee attrition by department?
Yes. If your employee data includes department information and reliable exit dates, you can analyse employee exits and attrition by department. Ensure that the attrition denominator is calculated consistently.
5. Can I refresh an HR dashboard automatically?
Yes, where the data source, credentials, connectivity, and Power BI configuration support scheduled refresh. The refresh process should be tested to ensure the dashboard reflects updated data correctly.
6. How can I learn to build HR dashboards in Power BI?
Practise with a sample employee dataset and learn Power Query, data modeling, DAX, visual design, and Power BI Service. For structured, instructor-led learning, explore TechnoExcel's Power BI Mastery program.
Conclusion
Creating an HR dashboard in Power BI involves more than placing charts on a report page. You need clean employee data, reliable KPI definitions, a suitable data model, accurate DAX measures, and a layout that helps HR teams make informed decisions.
Start with a small set of workforce metrics, validate your calculations, and expand the dashboard as your reporting needs develop. With regular practice, you can build HR reports that make employee trends easier to understand and workforce planning more data-driven.
Want to develop practical Power BI skills beyond basic charts? Explore TechnoExcel's Power BI Mastery training to learn data modeling, DAX, dashboard design, and Power BI Service through structured, hands-on training.
This topic is covered in the Power BI Mastery course. Sessions are live, practical and taught with real business data — a natural next step if this article matches what you are working on.