How to Become a Power BI Developer in 2026: A Step-by-Step Roadmap
To become a Power BI developer in 2026, learn data fundamentals, SQL, Power Query, data modeling, DAX, visualization and Power BI Service, then build real projects and learn Microsoft Fabric and security. PL-300 can validate your Power BI skills, but a strong portfolio is equally important.
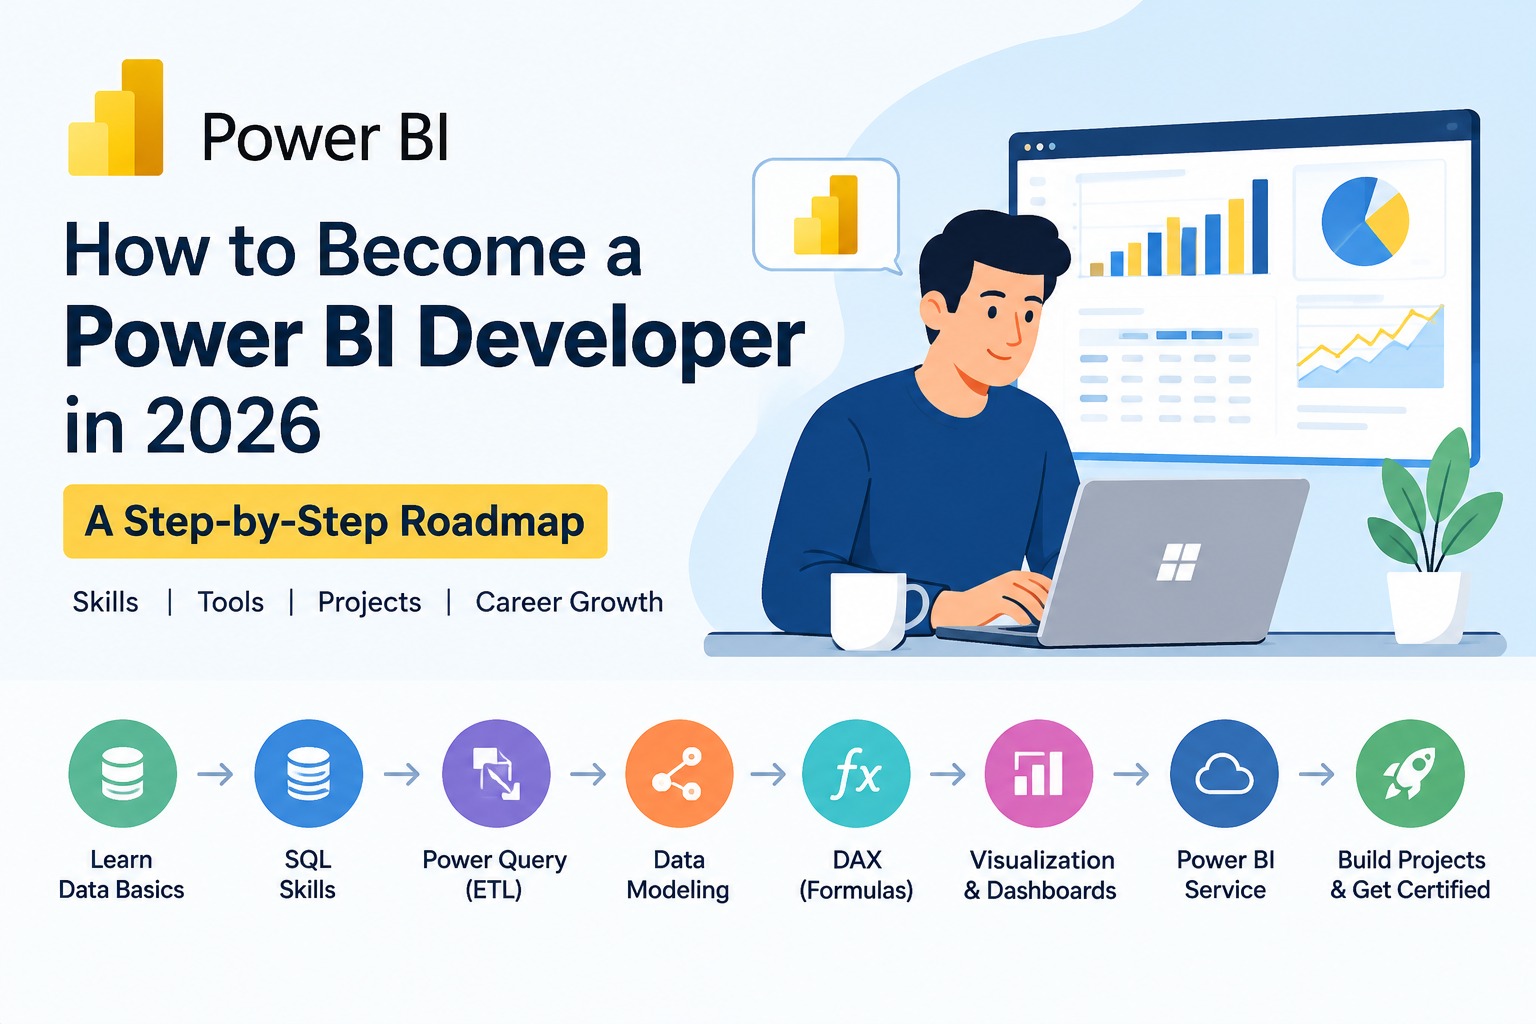
To become a Power BI developer in 2026, learn data fundamentals, SQL, Power Query, data modeling, DAX, visualization and Power BI Service, then build real projects and learn Microsoft Fabric and security. PL-300 can validate your Power BI skills, but a strong portfolio is equally important.
What does a Power BI developer do?
A Power BI developer turns raw business data into reliable reports, dashboards and insights. The job involves much more than creating charts. A developer may connect to databases, clean data with Power Query, build a semantic model, write DAX measures, design reports, manage refreshes, apply security and publish solutions through Power BI Service.
A typical workflow looks like this:
Business requirement → Data sources → Power Query → Data model → DAX → Report → Power BI Service → Security → Business insights
Microsoft's current Power BI role guidance follows a similar workflow: prepare data, model data, visualize and analyze it, then manage and secure Power BI solutions.
What skills do you need to become a Power BI developer?
You don't need to master every Microsoft tool before starting. Focus on the skills in the right order.
| Skill | Why it matters | Priority |
|---|---|---|
| Excel | Builds data and reporting fundamentals | High |
| SQL | Helps extract data from databases | High |
| Power Query | Cleans and transforms data | Very High |
| Data modeling | Keeps reports accurate and scalable | Very High |
| DAX | Creates business calculations and KPIs | Very High |
| Visualization | Communicates insights clearly | High |
| Power BI Service | Publishes and manages reports | High |
| RLS & security | Controls data access | High |
| Microsoft Fabric | Adds modern analytics skills | Growing |
| AI/Copilot | Speeds up analytics workflows | Growing |
The important point is not to learn these as separate tools. Learn how they work together.
Step 1: Build your Excel and data foundations
If you're completely new to analytics, start with basic data concepts.
You should understand:
- Rows and columns
- Data types
- Sorting and filtering
- PivotTables
- Basic formulas
- Lookup logic
- Tables
- Basic charts
- Fact and dimension concepts
You don't need to become an Excel expert before touching Power BI. But good Excel knowledge makes Power BI easier to understand.
For example, if you already understand PivotTables and lookup logic, concepts such as relationships, measures and filtering will feel less unfamiliar.
Step 2: Learn SQL for real-world data
SQL is one of the most useful supporting skills for a Power BI developer because business data often lives in relational databases.
Start with:
- SELECT
- WHERE
- ORDER BY
- GROUP BY
- HAVING
- Aggregate functions
- INNER JOIN
- LEFT JOIN
- Subqueries
- CTEs
- Window functions
You don't need to become a database administrator.
Your goal is to answer questions such as:
“Can I extract the sales data I need before bringing it into Power BI?”
That skill becomes increasingly useful as you move from beginner dashboards to enterprise reporting.
Step 3: Master Power Query
Power Query is where you turn messy source data into usable data.
Learn how to:
- Remove duplicates
- Handle null values
- Change data types
- Split and merge columns
- Merge queries
- Append queries
- Unpivot data
- Create conditional columns
- Work with multiple files
- Understand basic M code
- Understand query folding
Microsoft describes Power Query as the technology Power BI uses to connect to data sources, with connectors supporting different capabilities such as DirectQuery.
A good practice exercise
Take a messy Excel sales file and perform:
Raw data → Clean data → Transform → Combine → Load
Don't start with a perfectly prepared Kaggle dataset. Real Power BI work rarely looks that clean.
Step 4: Learn data modeling before advanced DAX
This is where many beginners make a mistake.
They learn 50 DAX functions before understanding how tables should relate to each other.
Learn:
- Fact tables
- Dimension tables
- Relationships
- Cardinality
- Filter direction
- Date tables
- Star schema
- Measures vs calculated columns
Microsoft recommends star-schema principles for Power BI semantic models because fact tables support summarization while dimension tables support filtering and grouping.
A simple model could look like:
FactSales
connected to:
- DimCustomer
- DimProduct
- DimDate
- DimRegion
Once your model is correct, your DAX becomes much easier to manage.
Step 5: Learn DAX properly
DAX is one of the biggest differences between a beginner and a strong Power BI professional.
Start with:
- SUM
- COUNT
- COUNTROWS
- AVERAGE
- DIVIDE
- IF
- CALCULATE
- FILTER
- SUMX
- RELATED
- Variables
- Time intelligence
Then understand the concepts behind the formulas:
Row context → Filter context → Context transition → CALCULATE
Don't try to memorize hundreds of functions.
Instead, build business calculations such as:
- Total Sales
- Gross Profit
- Profit Margin
- Year-over-Year Growth
- YTD Sales
- Target Achievement
- Customer Retention
- Average Order Value
That makes your DAX learning much more practical.
Step 6: Learn dashboard design and data storytelling
A Power BI developer isn't paid simply for knowing where the chart buttons are.
You need to know which visual answers which business question.
| Business question | Useful visual |
|---|---|
| How are sales changing? | Line chart |
| Which product performs best? | Bar chart |
| What is the current KPI? | Card |
| Which region is underperforming? | Bar chart / map |
| How does performance change by month? | Line chart |
| What are the detailed transactions? | Table / matrix |
Focus on:
- Clear KPI hierarchy
- Simple layouts
- Consistent formatting
- Slicers
- Drill-through
- Tooltips
- Bookmarks
- Mobile layouts
- Accessibility
A dashboard should help someone answer a business question quickly.
Step 7: Learn Power BI Service
This is a skill many beginners skip.
Power BI Desktop is mainly where you build. Power BI Service is where organizations publish, share, manage and govern their analytics.
Learn:
- Workspaces
- Publishing
- Apps
- Permissions
- Scheduled refresh
- Semantic models
- Sharing
- Data gateways
- Subscriptions
- Row-Level Security
- Deployment concepts
Microsoft's current documentation also treats workspace access and RLS as separate parts of managing Power BI content and data access.
If you're targeting professional Power BI roles, don't stop at Desktop.
Step 8: Learn Power BI security and performance
As your reports become more complex, technical quality matters.
Learn security
Understand Row-Level Security (RLS).
For example:
A national sales report could allow:
- North manager → North data
- South manager → South data
- Finance head → All regions
RLS restricts which rows users can access within a Power BI semantic model.
Learn performance
Practice:
- Removing unnecessary columns
- Reducing unnecessary rows
- Using suitable data types
- Improving the model
- Avoiding unnecessary relationships
- Writing efficient DAX
- Checking visual performance
A dashboard that looks good but takes 30 seconds to load is not a good production dashboard.
Step 9: Learn Microsoft Fabric and modern Power BI
This is one of the areas that separates a 2026 roadmap from an old Power BI roadmap.
Power BI now sits within the broader Microsoft Fabric ecosystem.
You don't need to become a Fabric expert before getting your first Power BI job. But understanding the basics can give you an advantage.
Start with:
- Microsoft Fabric
- OneLake
- Semantic models
- Lakehouse concepts
- Direct Lake
- Fabric data pipelines
- Power BI integration
Microsoft's current Fabric documentation describes Direct Lake as a storage mode that lets Power BI semantic models consume data from the lake without the traditional import approach.
What about AI?
Learn how AI and Copilot can support Power BI work, but don't depend on them to understand your model.
AI can help write a calculation. It cannot replace your understanding of whether the calculation is correct.
That distinction will become increasingly important as AI-assisted analytics becomes more common.
Step 10: Build a Power BI portfolio
This is where learning becomes job preparation.
Don't build ten identical sales dashboards.
Build 3-4 projects that demonstrate different skills.
Project 1: Sales analytics
Show:
- Revenue
- Profit
- Growth
- Product performance
- Regional analysis
- Time intelligence
Project 2: HR analytics
Show:
- Headcount
- Attrition
- Department analysis
- Employee trends
- KPI calculations
Project 3: Finance or operations
Show:
- Budget vs actual
- Variance
- Monthly trends
- Department performance
Project 4: Advanced project
Include something such as:
- RLS
- Advanced DAX
- Performance optimization
- Multiple data sources
- Power BI Service
- Automated refresh
The goal is not to impress people with colorful dashboards.
The goal is to prove:
I can take a business problem, work with data and build a solution.
How long does it take to become a Power BI developer?
A realistic learning timeline depends on your starting point and study time.
| Stage | Approx. time | Main focus |
|---|---|---|
| Foundation | 2–4 weeks | Excel, data basics, SQL |
| Power BI basics | 2–3 weeks | Desktop, data sources |
| Power Query | 2–3 weeks | Data cleaning |
| Data modeling | 2–3 weeks | Relationships, star schema |
| DAX | 3–5 weeks | Measures, context, time intelligence |
| Reporting | 2 weeks | Dashboards and storytelling |
| Service & security | 1–2 weeks | Publishing, refresh, RLS |
| Portfolio | 3–6 weeks | Real projects |
| PL-300 preparation | 3–6 weeks | Exam-focused practice |
For many beginners, 6–9 months of consistent practice is a more realistic target for becoming genuinely job-ready than trying to master everything in a few weeks.
Is PL-300 necessary to become a Power BI developer?
No, PL-300 is not a mandatory prerequisite for becoming a Power BI developer. However, Microsoft's PL-300 certification can validate Power BI Data Analyst skills and provide a structured learning target.
The current Microsoft certification covers:
- Preparing data
- Modeling data
- Visualizing and analyzing data
- Managing and securing Power BI
Microsoft currently classifies the certification as an intermediate Power BI/Data Analyst credential.
So use PL-300 as a skills benchmark, not as a replacement for projects.
Power BI developer vs data analyst: what's the difference?
These roles can overlap, especially in smaller organizations.
| Power BI Developer | Data Analyst |
|---|---|
| Focuses heavily on BI solutions | Focuses heavily on analysis |
| Builds semantic models | Analyzes business questions |
| Writes DAX | Uses SQL, Excel, Power BI, Python etc. |
| Develops dashboards | Interprets data |
| Handles Power BI Service | Presents insights |
| May manage security/deployment | May work closely with business teams |
In practice, job titles vary between companies. That's why learning the broader analytics stack Excel + SQL + Power BI + business understanding can give beginners more flexibility.
Common mistakes when learning Power BI
Learning visuals before data modeling
A beautiful dashboard with incorrect relationships is still a bad dashboard.
Memorizing DAX
Understanding filter context is more valuable than memorizing 100 functions.
Ignoring SQL
You can build Power BI reports without advanced SQL, but SQL becomes valuable when working with real business databases.
Learning only Power BI Desktop
Professional work often involves publishing, refresh, security and collaboration.
Building only tutorial projects
A copied YouTube dashboard doesn't demonstrate much problem-solving ability.
Using AI without understanding the output
Use AI to accelerate your work not to replace your understanding of DAX, data models or business logic.
Power BI developer roadmap: the simplest learning order
If you're starting from zero, follow this order:
Excel & Data Basics ↓ SQL Fundamentals ↓ Power BI Desktop ↓ Power Query ↓ Data Modeling & Star Schema ↓ DAX ↓ Dashboard Design ↓ Power BI Service ↓ Security & Performance ↓ Real Projects ↓ PL-300 ↓ Fabric & AI Skills
This order is more important than trying to learn everything simultaneously.
Frequently asked questions
Can I become a Power BI developer without a coding background?
Yes. Power BI does not require traditional software-development skills to get started. However, SQL, DAX and basic data concepts become important as you move toward professional roles.
Is SQL necessary for Power BI developers?
SQL is not mandatory for every role, but it is highly valuable. Many business datasets come from databases, so SQL helps you understand, extract and validate the data behind Power BI reports.
Do I need Python to become a Power BI developer?
No. Python can be useful for advanced analytics and automation, but you can become a Power BI developer without it. Prioritize Power Query, data modeling, DAX, SQL and Power BI Service first.
Is Power BI difficult to learn?
The basics are relatively approachable. The harder part is becoming good at data modeling, DAX, performance, security and business problem-solving. That is why real projects matter more than simply completing tutorials.
How many Power BI projects should I build?
Start with three strong projects rather than ten basic dashboards. Make sure you can explain the data source, transformations, model, DAX calculations, design decisions and business insights for each project.
Is PL-300 worth it in 2026?
PL-300 can be useful if you want a structured benchmark or certification for Power BI Data Analyst skills. It should complement not replace hands-on Power BI projects.
Should I learn Excel before Power BI?
If you're a beginner, yes. You don't need advanced Excel expertise, but understanding tables, PivotTables, formulas and basic data analysis makes the transition easier.
What should I learn after Power BI?
Once your core Power BI skills are strong, consider Microsoft Fabric, advanced SQL, cloud data platforms, automation and AI-assisted analytics depending on the type of role you want.
Can freshers become Power BI developers?
Yes. Freshers can start with junior data analyst, BI analyst or reporting roles and move toward Power BI development. A portfolio that demonstrates real data preparation, modeling, DAX and reporting can strengthen your profile.
Final thoughts
Becoming a Power BI developer in 2026 is not about learning every Power BI feature.
It is about learning how to move from:
Raw data → Clean data → Data model → DAX → Dashboard → Deployment → Business decision
Start with the fundamentals, build real projects and gradually add Power BI Service, security, Fabric and AI skills.
If you want structured, instructor-led practice rather than learning each topic separately, TechnoExcel's Power BI Mastery program covers Power BI Desktop and Service, Power Query, star-schema modeling, DAX, RLS, workspace permissions, scheduled refresh and dashboard design using realistic business data.TechnoExcel Power BI Training
This topic is covered in the Power BI Mastery course. Sessions are live, practical and taught with real business data — a natural next step if this article matches what you are working on.