How to Create a Finance Dashboard in Power BI
To create a finance dashboard in Power BI, connect your financial data, clean it in Power Query, build a reliable data model, create DAX measures, and visualise revenue, expenses, profit, cash flow, and budget variance. Validate the calculations against your financial records before publishing the report.
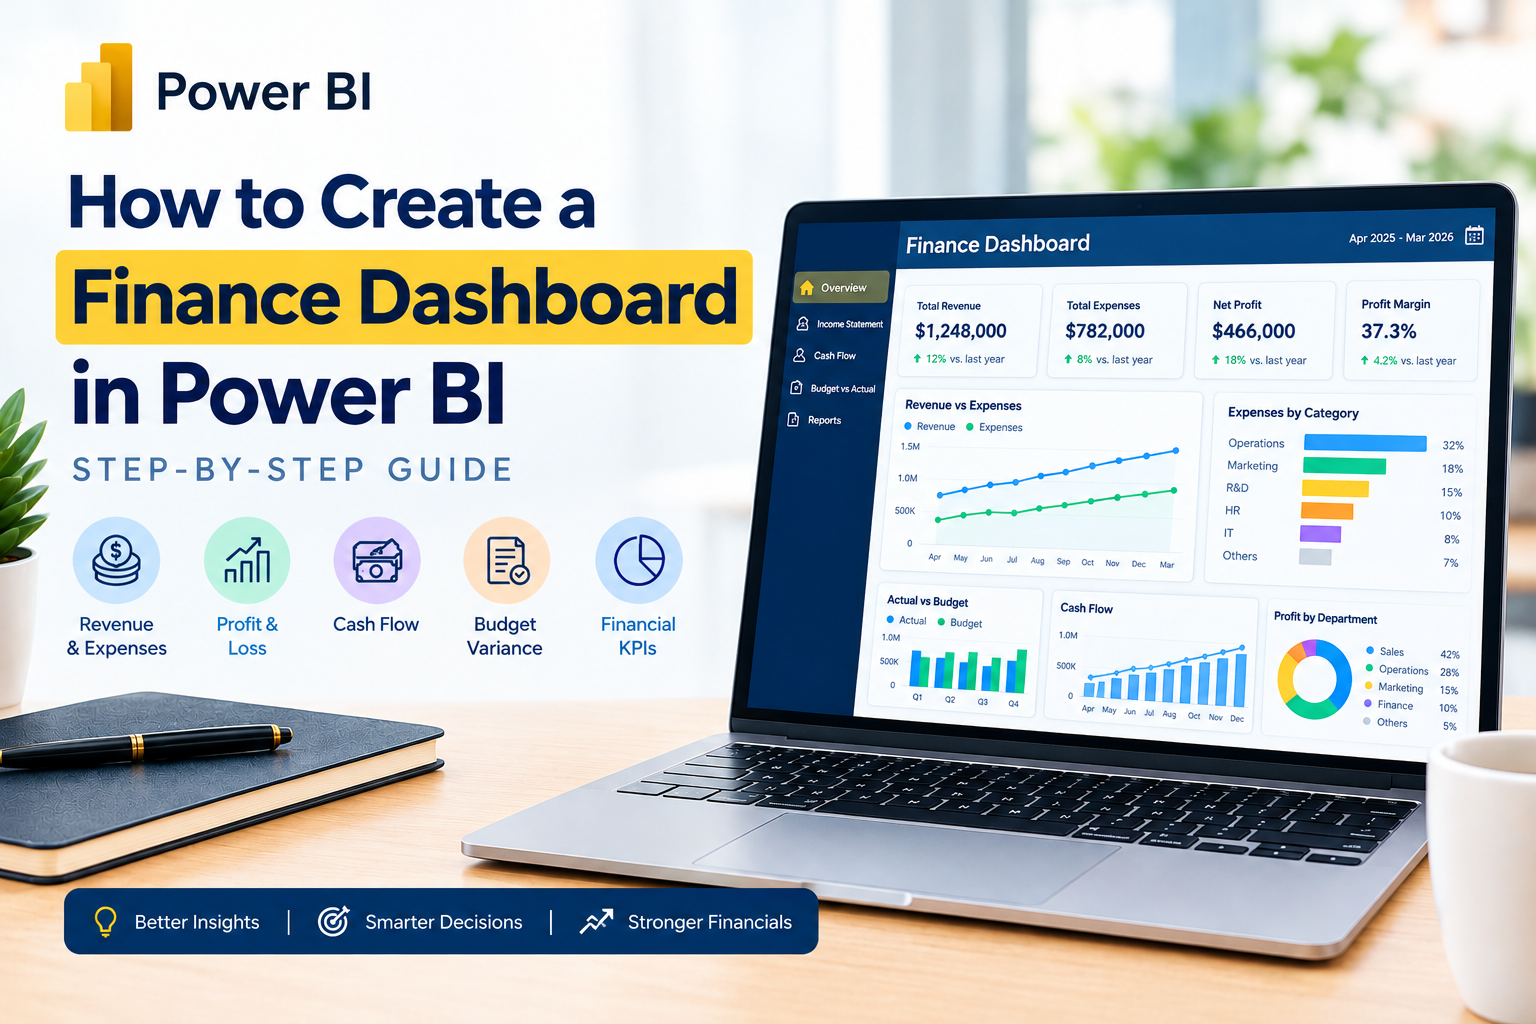
What Is a Finance Dashboard in Power BI?
A finance dashboard in Power BI is an interactive report that helps businesses monitor financial performance in one place. It can show revenue, operating expenses, gross profit, net profit, cash flow, and actual-versus-budget performance across different periods, departments, and business units.
Instead of combining multiple spreadsheets for every monthly review, finance teams can use Power BI to analyse financial data, identify trends, and investigate changes in performance.
For example, a finance manager can compare monthly revenue against budget, identify departments with rising expenses, or investigate why profit margins declined during a particular quarter.
Why Should Businesses Use Power BI for Financial Reporting?
Power BI makes financial reporting more interactive and repeatable when the underlying data model and refresh process are configured correctly.
Key benefits include:
- Centralised reporting: Combine data from spreadsheets, databases, and supported business systems.
- Budget tracking: Compare actual results against approved budgets.
- Profitability analysis: Monitor gross profit, net profit, and profit margins.
- Trend analysis: Compare monthly, quarterly, and yearly financial performance.
- Expense monitoring: Identify which departments or categories contribute most to spending.
- Reduced manual work: Reuse data-cleaning steps and refresh reports without rebuilding every chart manually.
A dashboard does not replace accounting controls or financial statements. It helps users analyse financial information more efficiently, provided that the data and calculations remain accurate.
Which KPIs Should a Finance Dashboard Include?
Start with the financial metrics that answer the most important business questions. A dashboard for senior management may need a different set of KPIs from one used by an accounts or budgeting team.
| Finance KPI | What it measures | Why it matters |
|---|---|---|
| Total Revenue | Income from business activities | Tracks sales and income trends |
| Total Expenses | Costs incurred during the period | Helps monitor spending |
| Gross Profit | Revenue minus cost of goods sold | Shows profitability before operating expenses |
| Gross Profit Margin | Gross profit as a percentage of revenue | Helps compare profitability |
| Net Profit | Profit after applicable expenses | Indicates overall profitability |
| Net Profit Margin | Net profit as a percentage of revenue | Shows how much revenue becomes profit |
| Budget Variance | Actual result compared with budget | Highlights financial performance against plan |
| Operating Cash Flow | Cash generated or used by operations | Helps assess operating cash generation |
Include cash balance, receivables, payables, or working capital when those measures are relevant and supported by reliable data. Cash balance and cash flow are different metrics and should not be treated as interchangeable.
What Data Do You Need to Build a Finance Dashboard?
Before opening Power BI, identify where the financial data comes from and how each table will be used.
A practical starting model may include these tables:
| Table | Important columns | Purpose |
|---|---|---|
| Transactions | Date, AccountID, Amount, DepartmentID | Stores actual financial transactions |
| Chart of Accounts | AccountID, AccountName, AccountGroup | Classifies accounts into revenue, expenses, and other groups |
| Budget | Date or Month, AccountID, BudgetAmount, DepartmentID | Stores planned financial values |
| Date | Date, Year, Quarter, Month, MonthNumber | Supports time-based analysis |
| Department | DepartmentID, DepartmentName | Enables department-level reporting |
The exact structure depends on your source system. Your transaction data might come from Excel exports, accounting software, an ERP system, or a database.
Important: Actuals and budgets must have compatible reporting dimensions. If actuals are recorded by transaction date and account while budgets are recorded only by month and department, you need a model that handles those differences correctly before comparing them.
How to Create a Finance Dashboard in Power BI
Step 1: Connect Your Financial Data
Open Power BI Desktop and select Home → Get Data. Choose your data source, such as Excel, CSV, SQL Server, or another supported connector.
Load the transaction, budget, chart-of-accounts, and date-related data you need.
Before proceeding, check that:
- Dates are recognised as dates.
- Financial amounts are numeric.
- Account IDs are consistent between tables.
- Budget periods match the intended reporting periods.
- The data covers the periods you want to analyse.
If your source files contain separate monthly sheets, you may need to combine them into a single structured table.
Step 2: Clean the Data in Power Query
Select Transform Data to open Power Query Editor.
Complete the following checks:
- Remove unnecessary columns and empty rows.
- Correct date, text, and decimal data types.
- Standardise account and department names.
- Investigate missing amounts and duplicate transactions.
- Combine monthly files where appropriate.
- Check whether expenses are stored as positive or negative amounts.
Do not automatically delete every duplicate. Two legitimate transactions can have identical dates and amounts. Use transaction IDs or other business rules to determine whether a record is actually duplicated.
Power Query saves transformation steps, making it easier to repeat data preparation during refreshes. For a related tutorial, read TechnoExcel's Power Query in Power BI beginner's guide.
Step 3: Build the Data Model
A well-designed data model is essential for accurate financial calculations.
Connect your transaction table to the relevant dimension tables, such as Date, Chart of Accounts, and Department. Where actuals and budgets are separate fact tables, connect them to shared dimensions rather than joining the two tables directly without considering their granularity.
For example:
- Date filters actual transactions and budget periods.
- Chart of Accounts groups transactions into financial categories.
- Department filters actual and budget results where the data supports that comparison.
Microsoft recommends using star-schema principles to organise Power BI semantic models for usability and performance. Read the official Power BI star schema guidance when designing your relationships.
Step 4: Create Financial Measures Using DAX
DAX measures calculate financial metrics based on the filters applied to the report. The following examples assume a table named Transactions, a numeric Amount column, and a Chart of Accounts table related to the transactions.
Total Revenue
Total Revenue =
CALCULATE(
SUM(Transactions[Amount]),
'Chart of Accounts'[AccountGroup] = "Revenue"
)
This example assumes revenue is stored as a positive amount and account groups are correctly mapped.
Total Expenses
Total Expenses =
CALCULATE(
SUM(Transactions[Amount]),
'Chart of Accounts'[AccountGroup] = "Expenses"
)
This measure assumes expense amounts are also stored as positive values. If your accounting system stores expenses as negative amounts, adapt the measures to match the source convention.
Gross Profit
Gross Profit =
[Total Revenue] - [Total COGS]
This requires a separate [Total COGS] measure that correctly identifies cost-of-goods-sold accounts.
Gross Profit Margin
Gross Profit Margin % =
DIVIDE(
[Gross Profit],
[Total Revenue],
0
)
Net Profit
Net Profit =
[Total Revenue]
- [Total COGS]
- [Total Operating Expenses]
This simplified calculation assumes those categories fully represent the intended profit calculation. Other income, finance costs, taxes, and accounting adjustments may need to be included for a formal net profit figure.
Actual-versus-budget variance
Budget Variance =
[Actual Amount] - [Budget Amount]
Budget Variance % =
DIVIDE(
[Budget Variance],
[Budget Amount],
0
)
Create the [Actual Amount] and [Budget Amount] measures according to your model. Format the variance as currency and the variance percentage as a percentage.
A positive variance is not always favourable. For revenue, actuals above budget are usually positive; for expenses, spending above budget may be unfavourable. Use a clear business rule or a separate favourable/unfavourable indicator.
If you're developing your DAX skills, TechnoExcel's Power BI interview questions and answers guide covers Power Query, data modeling, relationships, and other core Power BI concepts.
Step 5: Design the Finance Dashboard Layout
Organise the dashboard around the questions a finance manager needs to answer.
Top row: Financial KPI cards
- Total Revenue
- Total Expenses
- Gross Profit
- Net Profit
- Net Profit Margin
Middle section: Financial performance
- Line chart for revenue and expenses over time.
- Bar chart for expenses by department or category.
- Column chart for actual versus budget by month.
Bottom section: Detailed financial analysis
- Profit-and-loss matrix by account group.
- Budget variance by department.
- Cash-flow trend, if reliable cash-flow data is available.
Keep the most important numbers at the top and use clear titles, consistent currency formats, and readable labels. Avoid adding visuals that do not help users answer a financial question.
Step 6: Add Slicers and Interactive Filters
Add slicers so users can analyse results by:
- Year, quarter, and month.
- Department or cost centre.
- Region or business unit.
- Product or service category.
- Scenario, such as Actual, Budget, or Forecast, if the model supports it.
Test the interactions between visuals. A department filter should update the relevant actual and budget measures consistently.
If you report in multiple currencies, do not simply add amounts in different currencies together. Convert them using an agreed exchange-rate methodology before presenting a consolidated total.
Step 7: Validate and Publish the Dashboard
Before sharing the report, compare its results with trusted financial records.
Use this checklist:
- Revenue and expenses reconcile with the source report.
- Profit calculations follow the organisation's accounting definitions.
- Actuals and budgets use compatible periods and categories.
- Missing account mappings have been investigated.
- Filters do not produce misleading totals.
- Currency conversion rules are documented, where applicable.
- Access permissions protect confidential financial data.
Once validated, publish the report to Power BI Service and configure data refresh according to the source system and organisational requirements. Use suitable workspace permissions and row-level security when different users should see different data.
For a broader view of the skills involved in building and deploying Power BI reports, explore TechnoExcel's Power BI developer roadmap.
Common Finance Dashboard Mistakes to Avoid
| Mistake | Better approach |
|---|---|
| Comparing budgets and actuals at different levels of detail | Align the reporting grain and shared dimensions |
| Mixing positive and negative expense conventions | Standardise signs and document the calculation logic |
| Using an incorrect profit formula | Agree on account mappings and the required profit definition |
| Showing too many KPIs | Prioritise metrics that support financial decisions |
| Ignoring missing account mappings | Create and maintain an authoritative chart of accounts |
| Treating every positive variance as favourable | Interpret variance according to the metric |
| Publishing without reconciliation | Compare report totals against trusted financial records |
Frequently Asked Questions
1. Can I create a finance dashboard in Power BI using Excel?
Yes. You can import financial data from Excel, clean it with Power Query, create relationships, define DAX measures, and build interactive reports.
2. Which KPIs should a Power BI finance dashboard include?
Start with revenue, expenses, gross profit, net profit, profit margin, and budget variance. Add cash flow, receivables, payables, or working capital when relevant data is available.
3. How do I compare actuals versus budget in Power BI?
Create separate measures for actual and budget amounts, ensure both use compatible dimensions and reporting periods, then calculate the variance by subtracting budget from actual. Use a matrix or chart to compare results.
4. Which visuals work best for financial dashboards?
KPI cards show headline figures, line charts show trends, bar charts compare categories, and matrix visuals display detailed profit-and-loss information. Slicers help users filter the report.
5. Can Power BI automatically refresh financial data?
Yes, when the data source, credentials, connectivity, and refresh configuration support it. On-premises sources may require a gateway, and refresh schedules should be tested.
6. Is DAX required to create a finance dashboard?
Basic reports can be created with built-in aggregations, but DAX measures are important for consistent financial KPIs, profit calculations, time-based comparisons, and budget variance.
Conclusion
A useful finance dashboard in Power BI combines clean data, a reliable data model, accurate DAX measures, and a clear visual layout. Start with revenue, expenses, profit, and budget variance, then expand the report as your financial analysis needs grow.
Most importantly, validate the figures against trusted financial records before using the dashboard to support business decisions.
Want to build these skills through practical exercises? Explore TechnoExcel's Power BI training, which covers Power Query, data modeling, DAX, dashboard design, publishing, and security.
This topic is covered in the Power BI Mastery course. Sessions are live, practical and taught with real business data — a natural next step if this article matches what you are working on.