Python vs Excel for Data Analysis: Which Should You Learn in 2026?
Python vs Excel for data analysis is not really a choice between a “better” and “worse” tool. Excel is usually better for quick analysis, business reporting and interactive spreadsheet work, while Python is stronger for automation, repeatable workflows, complex analysis and larger datasets. For most data analysts, learning both is the most practical approach.
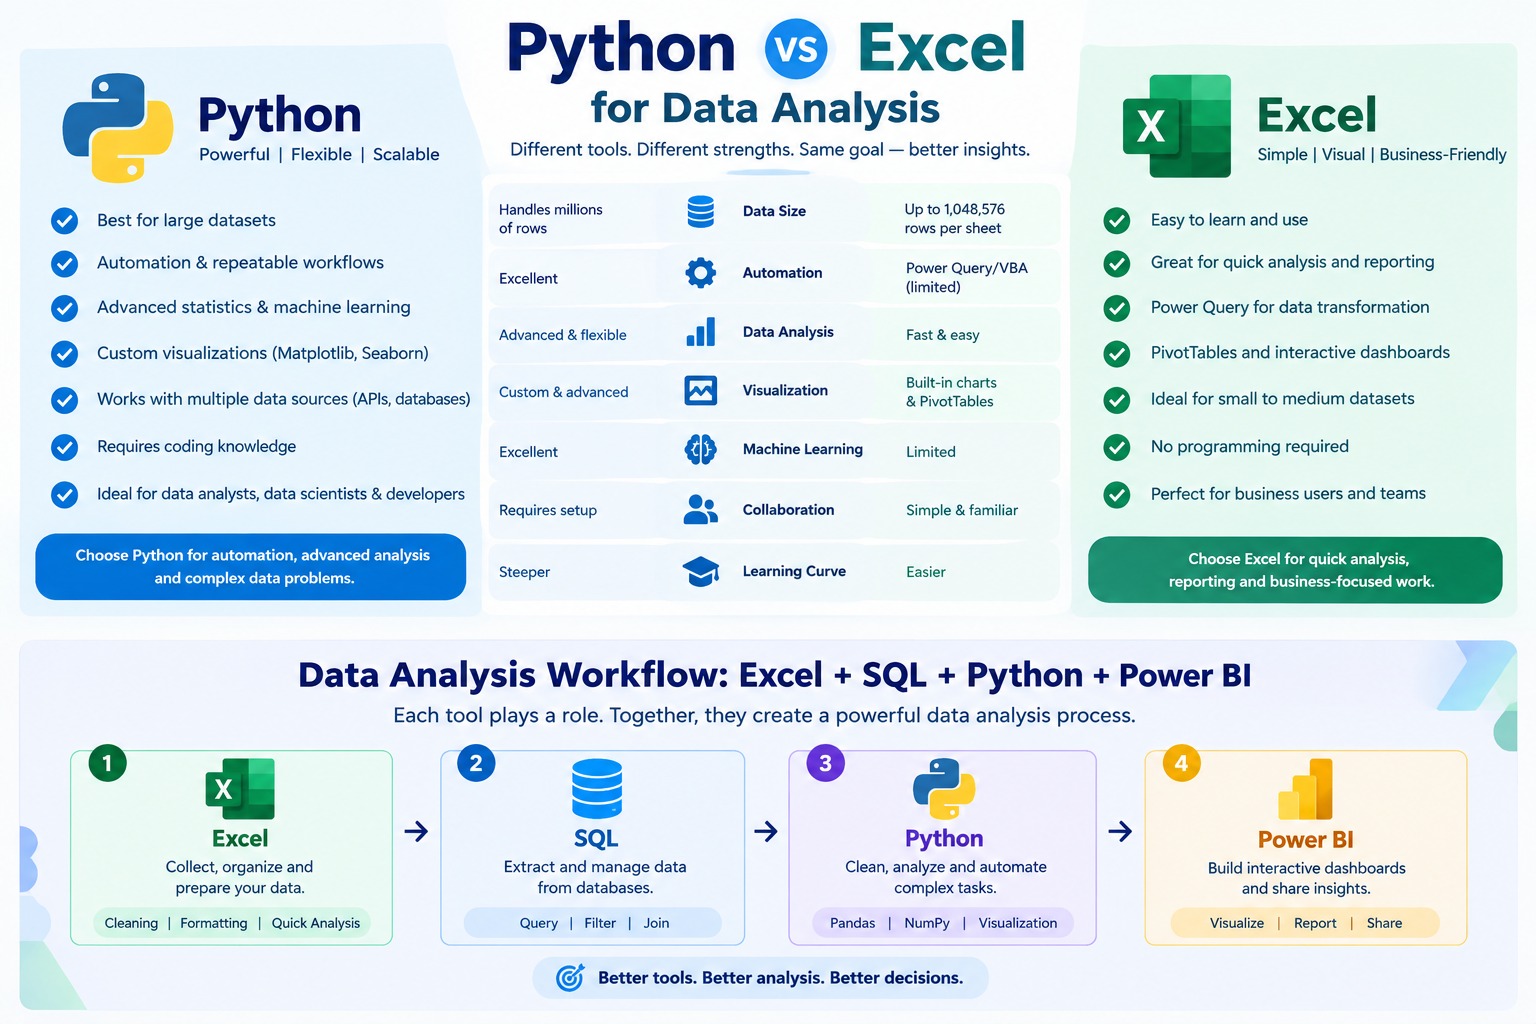
Python vs Excel for Data Analysis: What Is the Difference?
Python and Excel solve different data analysis problems.
Excel is a spreadsheet-based analysis tool designed for fast, visual and business-friendly work. You can inspect data directly in cells, write formulas, create PivotTables, build charts and share a workbook with colleagues.
Python is a programming language that becomes powerful for repeatable data processing, automation and advanced analysis. With libraries such as pandas and NumPy, analysts can clean, transform and analyze structured datasets using code. Pandas describes itself as a Python library for high-performance data structures and data analysis, with DataFrames designed for tabular data such as spreadsheets and database tables.
So the better question is not “Python or Excel?”
It is:
“Which tool is better for the job I need to do?”
Python vs Excel at a Glance
| Factor | Excel | Python |
|---|---|---|
| Ease of starting | Excellent | Moderate |
| No-code analysis | Excellent | Limited |
| Formulas | Excellent | Possible through code |
| Pivot-style analysis | Excellent | Strong with pandas |
| Large-scale data processing | Limited by spreadsheet workflow | Strong |
| Automation | Power Query/VBA available | Excellent |
| Advanced statistics | Good | Excellent |
| Machine learning | Limited | Excellent |
| Data visualization | Strong business charts | Highly customizable |
| Reproducibility | Moderate | Strong |
| Collaboration with business users | Excellent | Requires more technical setup |
| Best for | Business analysis and reporting | Programming, automation and advanced analysis |
Neither tool wins every category.
When Is Excel Better for Data Analysis?
Excel is better when the analysis is relatively quick, the data is manageable, and other people need to inspect or edit the workbook.
Excel works especially well for:
- Monthly MIS reports
- Financial analysis
- Budgeting
- Quick calculations
- What-if analysis
- PivotTables
- Business reports
- Small-to-medium datasets
- Ad-hoc analysis
- Sharing results with non-technical teams
For example, if a sales manager gives you a spreadsheet with 20,000 rows and asks for regional sales, product performance and monthly trends, Excel can handle the task comfortably.
You can clean the data with Power Query, summarize it with PivotTables and build a dashboard without writing a single line of Python.
TechnoExcel's Advanced Excel program focuses on exactly these business workflows, including XLOOKUP, Power Query, PivotTables, dashboards, automation and AI-assisted Excel workflows.
When Is Python Better Than Excel?
Python becomes more useful when the work is repetitive, complex, highly customized or difficult to manage manually in a spreadsheet.
Python is a strong choice when you need to:
- Process large datasets
- Repeat the same analysis every day or week
- Combine many files automatically
- Perform complex data transformations
- Run statistical analysis
- Build predictive models
- Connect to APIs
- Create reproducible workflows
- Automate reporting
- Work with machine learning
For example, imagine receiving 50 CSV files every Monday.
In Excel, you could use Power Query to combine them. But if the process requires custom logic, multiple transformations, validation rules and automated outputs, Python can make the workflow easier to reproduce and maintain.
Python vs Excel for Large Datasets
Python is generally more suitable when your analysis goes beyond what a spreadsheet workflow can handle comfortably.
An Excel worksheet has a maximum of 1,048,576 rows and 16,384 columns. Microsoft also notes that performance depends on available memory and system resources.
This does not mean that Python is automatically better once you cross a particular row count.
A 500,000-row dataset with simple calculations may work perfectly well in Excel.
The real issue is the combination of:
dataset size + complexity + repeatability + available memory + workflow requirements.
For larger or more complex analytical workflows, Python's pandas library provides DataFrames and tools for filtering, grouping, merging, reshaping and working with multiple data formats.
Python vs Excel for Data Cleaning
Both tools can clean data effectively.
Excel is excellent for:
- Removing duplicates
- Flash Fill
- Text to Columns
- Find and Replace
- Power Query
- Quick manual corrections
- Business-friendly transformations
Python is excellent for:
- Repeatable cleaning rules
- Large datasets
- Complex transformations
- Multiple input files
- Data validation
- Automated workflows
Pandas supports common operations such as handling missing data, merging datasets, grouping, reshaping and importing/exporting data.
The difference is repeatability.
If you clean one report once, Excel may be faster.
If you perform the same 15 cleaning steps every Monday, Python can turn those steps into a reusable process.
Python vs Excel for Automation
Python has an advantage when automation requires custom logic or several steps outside a normal spreadsheet workflow.
Excel already offers strong automation options through Power Query, VBA and modern Excel features.
For example, a weekly sales report could be automated in Excel by:
Power Query → PivotTable → Dashboard → Refresh
That may be all you need.
Python becomes useful when you need something like:
Multiple files → validation → cleaning → database/API → calculations → output → automated report
The best choice depends on the workflow, not the popularity of the tool.
Python vs Excel for Data Visualization
Excel is often easier for business reporting because charts, tables and formatting are directly connected to the workbook.
Python gives analysts more control over analytical visualizations.
Popular Python libraries include:
- Matplotlib
- Seaborn
- Plotly
- pandas plotting
Python is particularly useful when you need to generate the same visualization repeatedly or create customized analytical charts.
Excel is usually easier when the final audience wants to open the workbook, change filters and inspect the underlying numbers.
Python vs Excel for Statistics and Advanced Analysis
Python is generally the stronger choice for advanced statistical analysis and machine learning.
Excel includes useful statistical functions and tools, and it can be enough for many business questions.
Python gives you access to a much broader programming ecosystem.
For example, an analyst can use Python for:
- Regression analysis
- Statistical testing
- Forecasting
- Clustering
- Machine learning
- Feature engineering
- Advanced data transformations
That makes Python particularly useful when your career is moving from basic reporting toward advanced analytics or data science.
Python vs Excel for AI in 2026
The comparison has become more interesting because Excel itself now includes Python capabilities.
Microsoft's Python in Excel allows users to write Python directly in Excel cells. It runs Python calculations in the Microsoft Cloud and includes libraries such as pandas, NumPy, Matplotlib and seaborn.
This means you no longer have to think of Python and Excel as completely separate worlds.
You can use:
Excel → familiar spreadsheet interface
plus
Python → advanced analytics
within the same workflow.
Microsoft also supports Copilot in Excel with Python, combining AI assistance with Python-based analytics.
However, Python in Excel does not make traditional Python unnecessary. Microsoft notes that Python in Excel has specific environment, data-access and platform considerations. For example, data processed by Python in Excel comes from the worksheet or Power Query rather than unrestricted local file access.
Python in Excel vs Traditional Python
| Feature | Python in Excel | Traditional Python |
|---|---|---|
| Excel interface | Yes | No |
| Python code | Yes | Yes |
| Pandas | Yes | Yes |
| NumPy | Yes | Yes |
| Excel formulas | Yes | No |
| PivotTables | Yes | No |
| Full programming environment | Limited | Yes |
| External integrations | More restricted | Much broader |
| Best for | Excel users adding Python | Developers and analysts building workflows |
This is an important distinction for professionals deciding what to learn.
Should You Learn Python or Excel First?
For most beginners in data analytics, Excel is a sensible starting point because it teaches core analysis concepts without requiring programming.
Learn:
Excel → SQL → Python → Power BI
if your goal is to become a well-rounded data analyst.
But the order can change based on your background.
If you are a business professional
Start with:
Excel → Power BI → SQL → Python
If you already know Excel
Move directly toward:
SQL → Python → Power BI
If you want Data Science
A stronger path is:
Python → Statistics → Pandas/NumPy → Machine Learning
If you want automation
Consider:
Excel → Power Query/VBA → Python → APIs
There is no universal learning order.
Python vs Excel for Data Analyst Careers
Learning both Python and Excel gives analysts a broader toolkit than relying on either one alone.
Excel remains important because businesses use spreadsheets for reporting, planning, finance, operations and ad-hoc analysis.
Python adds capabilities for automation, advanced analysis and repeatable workflows.
TechnoExcel's current Data Analytics program reflects this combined approach: Advanced Excel, SQL, Python, Power BI and statistics are taught as one analyst toolkit.
The same principle appears in TechnoExcel's Data Analyst Skills guide, which positions Python as an important addition for analysts who want to automate work or handle analysis that becomes difficult in spreadsheets.
A Real-World Example: Sales Analysis
Suppose a company gives you monthly sales files from five regions.
Excel approach
- Import the files.
- Clean them with Power Query.
- Combine the data.
- Create PivotTables.
- Calculate KPIs.
- Build a dashboard.
- Share the workbook.
This is a strong Excel workflow.
Python approach
- Read the files with pandas.
- Validate the columns.
- Clean missing values.
- Combine the datasets.
- Group sales by region and product.
- Calculate KPIs.
- Create charts.
- Export the results.
Best approach?
For a one-time business report, Excel may be faster.
For a report that runs every week with the same logic, Python may provide more long-term value.
And in many organisations, the best solution is:
Python for processing → Power BI or Excel for reporting.
Can Python Replace Excel?
No, Python should not be viewed as a complete replacement for Excel.
Excel remains excellent for spreadsheet-based business work, interactive reporting and quick analysis.
Python is stronger for programming, automation, advanced analytics and repeatable data workflows.
The tools overlap, but they are designed around different ways of working.
The same is true in reverse: Excel cannot replace Python for every advanced analytical or software-development task.
Can Excel Replace Python?
Excel can replace Python for many simple and medium-complexity analysis tasks, but not all of them.
If you only need formulas, PivotTables, Power Query and dashboards, Excel may be enough.
If you need custom algorithms, advanced machine learning, complex automation, APIs or a reusable Python-based pipeline, Excel alone may not be the right tool.
Python vs Excel: Pros and Cons
| Excel | Python | |
|---|---|---|
| Pros | Easy to learn, visual, widely used, excellent for business reporting | Flexible, automated, scalable, powerful analytics ecosystem |
| Cons | Manual workflows can become difficult to maintain | Requires programming knowledge |
| Best advantage | Fast business analysis | Repeatable and advanced analysis |
| Biggest limitation | Spreadsheet complexity and worksheet limits | Higher learning curve |
Common Mistakes to Avoid
Choosing Python just because it sounds more advanced
A simple PivotTable may solve a business question faster than 50 lines of Python.
Assuming Excel is outdated
Excel continues to evolve. Power Query, Power Pivot, dynamic arrays, Copilot and Python in Excel have expanded what users can do inside the Microsoft ecosystem.
Using Python for every task
Programming adds complexity. If a five-minute Excel solution solves the problem, use it.
Learning Python without learning Excel
For business-focused data analysts, Excel remains a valuable practical skill.
Learning Excel without learning automation
If you repeat the same report every week, investigate Power Query, VBA or Python rather than repeating manual steps forever.
Which One Should You Learn in 2026?
Learn Excel if you want fast business analysis, reporting and spreadsheet-based work. Learn Python if you want automation, advanced analysis, programming or a path toward data science and AI. Ideally, learn both and understand when to use each.
| Your goal | Best starting point |
|---|---|
| MIS/reporting | Excel |
| Finance analysis | Excel |
| Quick business analysis | Excel |
| Dashboard preparation | Excel + Power BI |
| Repetitive data processing | Python or Power Query |
| Large/complex analysis | Python |
| Statistical analysis | Python |
| Machine learning | Python |
| Data analyst career | Excel + SQL + Python + Power BI |
| Data science career | Python + Statistics + ML |
Frequently Asked Questions
Is Python better than Excel for data analysis?
Python is better for automation, advanced analytics, complex transformations and repeatable workflows. Excel is better for quick business analysis, spreadsheet reporting and interactive work. Neither tool is universally better.
Is Excel easier than Python?
Yes. Excel generally has a lower learning curve because users can work directly with cells, formulas, tables and menus without learning programming syntax.
Can I use Python instead of Excel?
You can use Python for many analytical tasks, but it does not replace Excel's spreadsheet interface, business reporting features and ease of collaboration for every workflow.
Should a data analyst learn Excel or Python?
A data analyst should ideally learn both. Excel is useful for everyday business analysis, while Python expands your ability to automate and perform advanced analysis.
Is Python harder than Excel?
Yes, generally. Python requires programming concepts such as variables, functions, loops and data structures. Excel can provide useful analytical results without traditional programming.
Is Python faster than Excel?
It depends on the task. Python can be much more efficient for repeatable or complex processing, while Excel can be faster for quick, interactive analysis of a manageable dataset.
How many rows can Excel handle?
A worksheet supports up to 1,048,576 rows and 16,384 columns. Actual performance depends on the workbook, formulas, data model and available system resources.
Can Python handle Excel files?
Yes. Python's pandas library supports working with Excel files as well as CSV, SQL and other data sources.
Is Python in Excel worth learning?
Yes, especially for Excel users who want Python's analytical capabilities without leaving the Excel environment. It is different from learning the full Python ecosystem, so both skills can still be valuable.
What should I learn after Excel?
For a data analytics career, a strong next step is SQL, followed by Python and Power BI. The exact order depends on your role and current skills.
Final Verdict
Python vs Excel is not a winner-takes-all competition.
Excel remains one of the most practical tools for business analysis, reporting and quick decision-making. Python becomes increasingly valuable when you need automation, advanced analytics, complex transformations or repeatable workflows.
The strongest data analysts do not ask:
“Which tool should replace the other?”
They ask:
“Which tool solves this problem best?”
If you already work with Excel and want to move into Python, TechnoExcel's Python for Data Analytics program is designed specifically for analysts who want to go beyond what Excel can handle, with Pandas, NumPy, Matplotlib, Seaborn, DataFrames, automation and business datasets.
For a broader career path, the Data Analytics program combines Advanced Excel, SQL, Python, Power BI and statistics into one structured learning path.
This topic is covered in the Python for Data Analytics course. Sessions are live, practical and taught with real business data — a natural next step if this article matches what you are working on.