Python Skills for Data Analysts in 2026: Complete Guide
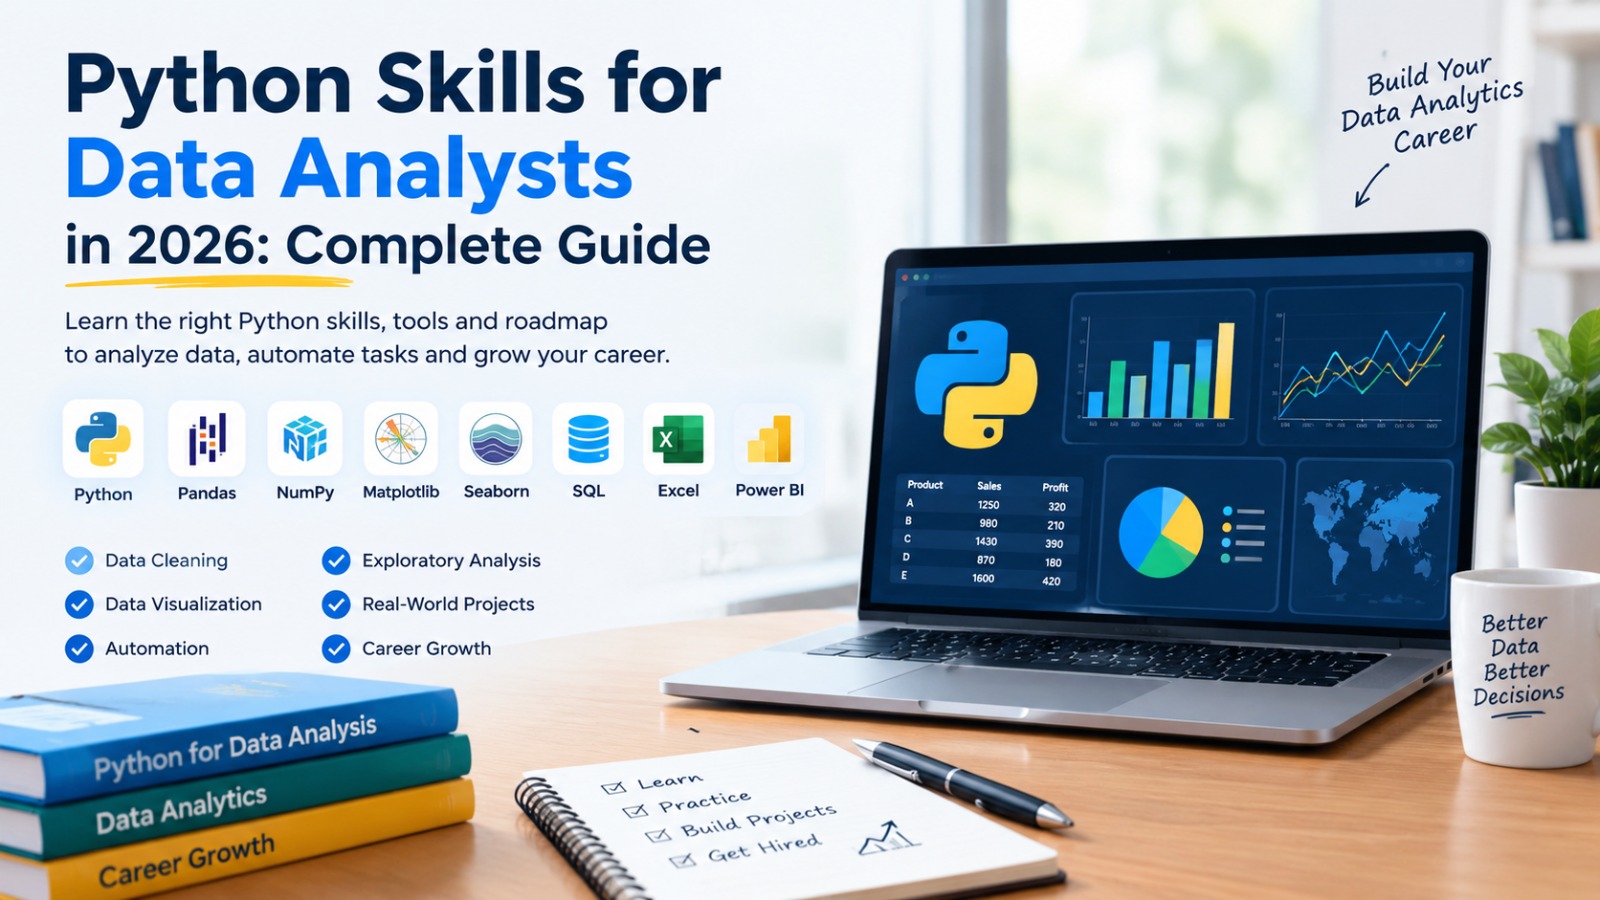
The most useful Python skills for data analysts in 2026 are Python fundamentals, Pandas, NumPy, data cleaning, data visualization, exploratory data analysis, automation and working with files or databases. Python works alongside Excel, SQL and Power BI rather than replacing them.
What Python Skills Does a Data Analyst Need in 2026?
A data analyst does not need to learn every part of Python. The most useful skills are the ones that help you clean, transform, analyze, visualize and automate data.
For most analysts, the practical Python stack includes Python fundamentals, Pandas, NumPy, Matplotlib or Seaborn, Jupyter Notebook, data cleaning, exploratory data analysis and basic automation.
Python becomes especially useful when datasets become larger, analysis becomes repetitive, or Excel and standard BI workflows are not flexible enough. It also provides a useful foundation for advanced analytics and AI-related work. Python remains highly relevant in AI and data work, with GitHub reporting strong Python growth and widespread use in AI-focused projects.
Python Skills Data Analysts Should Learn
You do not need advanced software-development skills to start using Python for data analysis. Focus on these skills in order.
| Python skill | What it helps you do |
|---|---|
| Python fundamentals | Write and understand basic scripts |
| Lists, dictionaries & functions | Organize data and reusable logic |
| Pandas | Clean, filter and transform datasets |
| NumPy | Perform numerical operations |
| Data cleaning | Handle missing, duplicate and incorrect data |
| Data visualization | Find and explain patterns |
| Exploratory data analysis | Understand datasets before reporting |
| File handling | Work with CSV and Excel files |
| SQL + Python | Extract data and analyze it |
| Automation | Reduce repetitive reporting work |
| Jupyter Notebook | Combine code, analysis and explanations |
1. Python Fundamentals
Start with the Python for Data Analytics concepts that support data work rather than trying to master the entire language.
You should understand:
- Variables and data types
- Strings and numbers
- Lists, tuples and dictionaries
- if, else and elif
- for and while loops
- Functions
- Basic error handling
- Reading and writing files
These concepts become useful when you start manipulating datasets and creating repeatable analysis workflows.
Python's official documentation describes it as a general-purpose language with a large standard library and an emphasis on readable syntax and productivity.
2. Pandas for Data Analysis
Pandas is one of the most important Python libraries for data analysts. It provides DataFrames and tools for working with structured datasets.
A data analyst should know how to:
- Import CSV and Excel files
- Inspect datasets
- Select rows and columns
- Filter records
- Sort data
- Handle missing values
- Remove duplicates
- Group and aggregate data
- Merge datasets
- Reshape data
- Create calculated columns
For example, if a sales team gives you separate customer, product and transaction files, Pandas can help clean and combine them before analysis.
Current data-analytics learning paths continue to place Pandas and NumPy at the center of Python-based analysis.
3. NumPy for Numerical Analysis
NumPy supports numerical computing in Python. Data analysts should understand arrays, indexing, slicing and common mathematical operations.
You do not need to become a NumPy specialist at the beginning. Learn enough to understand how numerical data is represented and processed, especially because many Python data tools build on the numerical computing ecosystem.
4. Data Cleaning With Python
Data cleaning is one of the most practical reasons to learn Python for data analysis. Real datasets often contain missing values, duplicates, inconsistent formats, incorrect data types and unusual records.
Python can help you:
- Identify missing values.
- Standardize formats.
- Remove duplicate records.
- Convert data types.
- Detect unusual values.
- Combine multiple datasets.
- Repeat the same cleaning process automatically.
This matters because analysts often spend more time preparing data than creating the final chart or dashboard.
Python for Exploratory Data Analysis
Exploratory Data Analysis, or EDA, helps you understand a dataset before making conclusions.
A typical Python EDA workflow can include:
- Checking rows and columns
- Understanding data types
- Measuring missing values
- Finding duplicates
- Looking at distributions
- Calculating averages and percentages
- Finding outliers
- Comparing groups
- Studying correlations
- Creating initial charts
For example, before building a sales dashboard, you could use Python to find which products have declining sales, which regions have unusual performance and whether missing records could affect the result.
The important skill is not simply writing Python code. It is knowing what question the analysis should answer.
Python Data Visualization Skills
Data analysts also need to communicate what they find.
Common Python visualization libraries include Matplotlib and Seaborn. They can be used for:
- Bar charts
- Line charts
- Histograms
- Scatter plots
- Box plots
- Heatmaps
- Distribution charts
Python visualization becomes particularly useful when you need repeatable charts, custom analysis or automated reporting.
However, Python does not make Power BI or Excel irrelevant. BI tools remain useful for interactive dashboards and business reporting. TechnoExcel's own analytics curriculum combines Python with Excel, SQL, statistics and Power BI because these tools solve different parts of the analytics workflow.
Python vs Excel vs SQL vs Power BI
Python, Excel, SQL and Power BI serve different purposes. A practical analyst should understand when to use each tool rather than trying to replace the entire workflow with Python.
| Tool | Best suited for |
|---|---|
| Excel | Quick analysis, formulas, reporting and smaller datasets |
| SQL | Querying and joining data stored in databases |
| Python | Cleaning, automation, advanced analysis and repeatable workflows |
| Power BI | Interactive dashboards, reporting and business visualization |
For example:
SQL → extract the data → Python → clean and analyze it → Power BI → present the findings
Excel can also be used at different stages depending on the business process.
This combined approach is also reflected in current 2026 data-analytics curricula, which commonly pair Excel, SQL, Python, statistics and BI tools.
Python Automation for Data Analysts
Python automation can save analysts from repeating the same manual work every week.
Common examples include:
- Combining multiple Excel files
- Cleaning recurring datasets
- Renaming files
- Generating reports
- Updating calculations
- Processing CSV files
- Extracting information from APIs
- Creating repeatable data pipelines
Imagine receiving 20 Excel files every Monday. Instead of opening and combining them manually, a Python script can perform the same steps consistently.
That is one of the biggest practical benefits of learning Python.
How Much Python Does a Data Analyst Need?
A data analyst usually needs practical Python rather than advanced software engineering.
For an entry-level analytics role, focus on:
Python basics → Pandas → NumPy → data cleaning → EDA → visualization → automation
Advanced topics such as machine learning, deep learning and complex software architecture depend on the role.
A reporting-focused analyst may use Python occasionally, while an analytics professional working with large datasets or automation may use it much more frequently. UniAthena similarly notes that Python becomes more valuable when work involves large datasets, repetitive tasks, custom logic and multiple data sources.
Python Skills Roadmap for Data Analysts
A practical learning order is:
Step 1: Learn Python basics
Understand variables, data types, conditions, loops and functions.
Step 2: Learn Pandas and NumPy
Start working with real CSV and Excel datasets.
Step 3: Practice data cleaning
Work with missing values, duplicates, incorrect formats and inconsistent data.
Step 4: Learn EDA
Use statistics and visualizations to identify patterns.
Step 5: Learn Matplotlib and Seaborn
Create charts that explain the data clearly.
Step 6: Combine Python with SQL
Learn how to extract data from databases and analyze it using Python.
Step 7: Automate repetitive tasks
Turn recurring manual processes into reusable scripts.
Step 8: Build practical projects
Use real-world datasets and explain the business problem, analysis and result.
Python Projects for Data Analyst Portfolios
Projects are important because they show how you apply your skills.
Good beginner-to-intermediate projects include:
| Project | Skills demonstrated |
|---|---|
| Sales analysis | Pandas, EDA, visualization |
| Customer churn analysis | Cleaning, statistics, business analysis |
| Excel report automation | Pandas, file handling, automation |
| Marketing campaign analysis | Data cleaning, segmentation, visualization |
| Inventory analysis | Pandas, aggregation, trend analysis |
| Customer purchase analysis | Merging, grouping, EDA |
A strong project should not stop at a chart. Explain the business question, data preparation, analysis, key finding and recommended action.
Python and AI: What Should Analysts Learn?
AI changes how analysts write and use code, but it does not remove the need to understand the analysis.
AI tools can help analysts:
- Generate Python code
- Explain errors
- Suggest data-cleaning approaches
- Create first-draft analysis
- Explain unfamiliar functions
- Speed up repetitive coding
But analysts still need to verify the output. A generated script can produce technically valid code while answering the wrong business question or handling data incorrectly.
This makes Python + analytical thinking + AI literacy more useful than learning Python syntax alone.
Common Mistakes When Learning Python for Data Analytics
Avoid these mistakes:
- Learning every Python concept before touching real data
- Memorizing syntax without practice
- Ignoring Pandas
- Ignoring data cleaning
- Learning machine learning too early
- Using Python when Excel or SQL would be faster
- Building projects without a business question
- Copying AI-generated code without checking it
- Learning many libraries without mastering the core ones
The goal is not to become a Python expert before becoming an analyst. The goal is to use Python to solve real data problems.
Frequently Asked Questions
Is Python necessary for data analysts in 2026?
Python is not mandatory for every data analyst role, but it becomes highly useful for automation, larger datasets, complex transformations and advanced analysis. Analysts should also understand Excel, SQL, visualization and basic statistics.
How much Python does a data analyst need?
Most beginners should focus on Python fundamentals, Pandas, NumPy, data cleaning, EDA, visualization and basic automation. Advanced Python depends on the role.
Should I learn Python or SQL first?
For many aspiring data analysts, SQL is an important foundation because business data often lives in databases. Python can then add automation and advanced analysis capabilities.
Can Python replace Excel for data analysis?
No. Python and Excel serve different purposes. Excel remains useful for quick analysis, business reporting and spreadsheet-based workflows, while Python is stronger for automation, repeatable analysis and larger or more complex datasets.
Is Pandas enough for Python data analysis?
Pandas is a major part of Python data analysis, but analysts should also understand Python fundamentals, NumPy, visualization, statistics and basic automation.
Is Python useful for Power BI users?
Yes. Python can help with data preparation, automation and advanced analysis. Power BI remains useful for interactive dashboards and business reporting.
Can I learn Python for data analysis without a programming background?
Yes. Start with basic Python concepts and move quickly into practical datasets. You do not need to master advanced software development before learning data analysis.
Is Python useful for AI careers?
Yes. Python is widely used across AI and machine-learning development. GitHub reported that nearly half of new AI-focused projects were primarily built with Python as of August 2025.
Which Python libraries should a data analyst learn?
Start with Pandas and NumPy, followed by Matplotlib and Seaborn. Add other libraries when your projects require them.
What is the best way to learn Python for data analytics?
Learn the basics, practice with real datasets, master Pandas, work on EDA and visualization, connect Python with SQL, then build automation and portfolio projects.
Final Takeaway
Python is an important part of the modern data analytics toolkit, but it works best as one part of a larger skill set.
Start with Python fundamentals, then focus on Pandas, NumPy, data cleaning, EDA, visualization and automation. Once those skills are comfortable, combine Python with SQL, Excel, Power BI and statistics to handle complete analytics workflows.
If your goal is to use Python on real business datasets rather than learn programming theory alone, a practical, project-based approach is the most useful next step. TechnoExcel's Python for Data Analytics training covers Pandas, NumPy, Matplotlib, Seaborn, data preparation, DataFrame operations, visualization and automation using business datasets.
This topic is covered in the Python for Data Analytics course. Sessions are live, practical and taught with real business data — a natural next step if this article matches what you are working on.